Resilience and Operability in Post-Disaster Scenarios: Case Study of a Defined Set of Churches after the L’Aquila Earthquake
Department of Engineering and Geology (INGEO), University G. d’Annunzio of Chieti-Pescara, Italy
Email: cristina.cantagallo@unich.it; valentino.sangiorgio@unich.it
*Corresponding author
Abstract. The digitization of built heritage is essential for safeguarding cultural and historical assets, particularly in the face of disruptive events. In this context, this paper assesses the resilience and operability of existing churches, supported by a comprehensive digitization workflow and a large dataset of data. Specifically, the work focuses on 26 churches of the Sulmona-Valva Diocese damaged during the 2009 L’Aquila earthquake. The proposed workflow integrates systematic data collection, the development of empirical and theoretical resilience curves, and the calculation of a Global Resilience Index. Unlike traditional methodologies, this study incorporates restoration funds as a weighting factor in resilience assessments, reflecting the cultural and historical importance of each structure. Additionally, the integration of data into a flexible digital platform enables real-time analysis and resilience planning, supporting informed decision-making for urban planning and resource allocation. These digital platforms significantly enhance the resilience assessment of cultural heritage by enabling the storage and processing of large datasets, thereby revolutionizing both academic research and operational practices. The findings highlight the potential of a data-driven framework to enhance the protection and conservation of heritage buildings in seismic-prone areas.
Keywords: Architectural engineering, Built heritage, Resilience, Earthquake, Church.
1. Introduction
The word “resilience”, as defined by contemporary dictionaries, refers to the ability of a system to return to its original state after being disturbed. Resilience is a multidisciplinary concept that applies to various fields, including ecology, social sciences, engineering, and economics. In seismic engineering, resilience is defined as the capacity of a system to absorb, manage, and adapt to seismic events. This concept is particularly crucial as it allows for the development of economic and political strategies aimed at reducing the impact of disruptive events. This study adopts an engineering-oriented approach to resilience assessment, integrating empirical and theoretical methods to quantify the ability of heritage churches to recover functionality after an earthquake.
In recent years, numerous authors have explored the concept of resilience from the engineering perspective, seeking ways to evaluate the resilience of specific or generic systems. The literature review conducted by Hosseini et al. [1] categorizes resilience evaluation methods into two primary types: 1) qualitative assessment approaches and 2) quantitative assessment procedures. Qualitative approaches include methods without specific mathematical formulations. Quantitative assessment procedures, on the other hand, offer measurable metrics that can be applied broadly or adapted to specific fields.
One of the first quantitative measures of resilience was proposed by Bruneau et al. [2-3] as the area under the functionality curve Q(t) of the system analyzed between the initial time of the extreme event t0 and the time corresponding to the end of the recovery process TR. When the extreme event is an earthquake E, these measures were named t0E and TRE, respectively. The approach proposed by Bruneau et al. [2-3] implements a general quantitative procedure independent of the type of the considered system (transport, buildings, infrastructure, hospitals, etc.) and is considered as the starting point of this work.
Over the past 15 years, many scientific publications have proposed new methods and approaches for quantitatively measuring resilience [4]. However, despite their number, these approaches can be classified into two macro-categories: a) probabilistic approaches and b) deterministic approaches, based on the presence or absence of a systematic evaluation of the uncertainties inherent to the extreme event and the capacity of the system, respectively. According to the probabilistic approach (a), the system’s functionality must be measured using a loss estimation method that considers uncertainties regarding future extreme events [5-10]. Chang and Shinozuka [5] introduced a probabilistic approach for assessing resilience, measured with two elements: (i) loss of performance and (ii) length of recovery. Resilience is defined as the probability that the initial performance loss of the system after an outage is less than the maximum acceptable performance loss and that the full recovery time is less than the maximum acceptable outage time. Youn et al. [6] define resilience as the sum of the passive survival rate (reliability) and proactive survival rate (restoration) following a disruption. Ayyub [7] measures resilience as a combination of “robustness” (how well a system resists problems) and “resourcefulness” (how quickly a system recovers). Using advanced probabilistic formulations, Ayyub’s [7] method considers both how to prevent problems (reliability) and how to handle them when they occur (recovery speed). Franchin and Cavalieri [8] developed a methodology to quantify the resilience of infrastructure networks following seismic events. Their approach evaluates network efficiency based on connectivity and accessibility, where closer node connections enhance overall performance. The proposed resilience index integrates multiple factors, including the number of displaced individuals, pre-earthquake network performance, and post-disaster recovery speed, with uncertainties addressed through a probabilistic approach. According to Cimellaro et al. [9-10], “resilience” is defined as a function indicating the capability to sustain a level of functionality. It is calculated as the area under the functionality curve, normalized to the control time, where the functionality is obtained from a probability function taking into account direct and indirect losses.
Other studies on resilience [11-13] determine the functionality of lifeline systems using deterministic approaches (b), based on time-dependent restoration curves calculated after specific earthquakes. Dueñas-Osorio et al. [11] developed a practical time-series approach to quantify lifeline system resilience. Using restoration data from power, potable water, and telecommunication systems following the 2010 Mw 8.8 Offshore Maule, Chile, earthquake, they constructed restoration curves that depict the fraction of subscribers with service over time, illustrating the recovery process. Cimellaro et al. [12-13] expanded upon the time-series approach to resilience assessment by introducing a method that quantifies the interdependency between critical infrastructure systems. They developed an equation based on the cross-correlation function between two restoration curves, allowing them to calculate an interdependency index. This index provides a numerical value that helps identify the systems that contribute most significantly to overall recovery challenges. By quantifying these interdependencies, the method enables more targeted allocation of resources, focusing on the systems that have the greatest impact on overall resilience. The deterministic nature of this approach facilitates statistical analysis of time series data, enabling an accurate resilience assessment of the asset under consideration. For this reason, it was selected as the reference method of this study. However, its implementation may present limitations due to data scarcity. Nevertheless, in the case analyzed in this study, the availability of previously inaccessible datasets – released over the years following the 2009 L’Aquila earthquake – has mitigated this limitation. Although deterministic approaches have been widely applied to assess the resilience of critical infrastructures and urban systems, their application to historical buildings remains limited. In particular, the resilience of heritage churches – complex architectural and structural typologies of essential cultural significance – has not been systematically addressed. This study aims to bridge this gap by adapting deterministic resilience assessment methods to cultural heritage.
Seismic resilience can be assessed at various levels, depending on the intended objective. At the individual structure level, seismic resilience is evaluated by measuring a building’s or infrastructure’s capacity to absorb seismic forces and recover its lost performance. However, resilience can also be evaluated on a broader scale by considering multiple structures or infrastructures belonging to the same system, such as an urban community, a diocese, or a local healthcare system. Resilience of a community is specifically defined in a framework formulated by Renschler et al. [14] and Cimellaro et al. [15]. It subdivides resilience into seven dimensions according to the acronym PEOPLES: Population and demographics, Environmental/ecosystem, Organized governmental services, Physical infrastructure, Lifestyle and community competence, Economic development, and Social-cultural capital. According to the PEOPLES framework, physical infrastructures can be divided into two major groups: facilities and lifelines. The first group includes residential, commercial, and cultural facilities, while the second consists of communications, healthcare, food supply, utilities, and transportation. However, this classification neglects two basic types of facilities and lifelines: critical physical infrastructures and heritage buildings. Critical infrastructures provide essential support for economic and social well-being, public safety, and the functioning of key government responsibilities. Historical buildings are a testament to our past and key elements of our cultural heritage. It is crucial to establish appropriate methods and procedures to assess their resilience to protect and preserve them for future generations. In view of these considerations, the analysis of the seismic resilience of the churches is particularly relevant, as most of them are national architectural and historical heritage. Additionally, as churches can contain significant numbers of people during celebrations, they can also be classified as critical physical infrastructures. This study builds upon previous works by adapting existing resilience assessment frameworks to the context of heritage churches and integrating digitalization processes to enhance resilience monitoring and management.
Beyond resilience assessment, digitalization has become increasingly relevant in heritage management. Digital tools facilitate the systematic collection, storage, and analysis of post-disaster recovery data, supporting informed decision-making for both structural interventions and conservation planning. Several studies [16-17] have demonstrated that integrating seismic vulnerability and risk assessments into digital platforms enhances monitoring capabilities and long-term heritage management. However, the application of such methodologies to quantitative resilience modeling remains limited. This research addresses this gap by developing a digitization workflow specifically tailored for engineering resilience assessments, incorporating a structured data management framework to optimize resource allocation and post-disaster intervention strategies.
This work presents a new path for the large-scale evaluation of the seismic resilience of heritage buildings. Using recent earthquake data, this approach adapts current theories on empirical and theoretical resilience curves to the built heritage to calculate a global resilience index. Additionally, it introduces and constructs a framework for digitizing the resilience of the built environment to support urban planning and resource allocation. The innovation is twofold: for the first time, data from different churches are used to obtain a global resilience index; furthermore, this work proposes guidelines for implementing this process in an integrated platform designed to enhance the digitization of the management of the built environment.
To this end, the seismic resilience of 26 churches in the Sulmona-Valva Diocese (Abruzzi, Italy) following the 2009 L’Aquila earthquake is assessed using both empirical and theoretical approaches. Initially, resilience is estimated through an empirical, quantitative analysis of observed damage after the earthquake, with a damage index assigned to each church. Subsequently, theoretical resilience curves are calibrated based on empirical data, allowing for the estimation of resilience even when detailed data is unavailable. This calibration adapts methods commonly used for lifeline systems to the specific context of heritage structures, thus creating a replicable model for resilience assessment. The evaluation of resilience is performed assuming that the complete recovery of structural functionality corresponds to the completion of the works and the reopening of the churches. Finally, the procedure for integrating the churches’ data into a dynamic and flexible platform is implemented, as well as the definition of the logic tree for the automation of the entire procedure.
2. Methodological Approach
2.1 Operational Framework
The proposed methodological approach consists of four detailed steps that define the resilience curves for heritage buildings. Each step is systematically described, highlighting both the methodological framework and the key innovations compared to the existing state of the art. To ensure clarity, this section presents the methodological aspects independently from the case study results, including appropriate references to support the methodological framework and clearly distinguishing it from the empirical findings.
1. Data Collection: The first step involves collecting data for the 26 churches considered in the analysis. This includes gathering values for the damage index of each church, which is calculated based on observed damage mechanisms affecting the primary structural elements. Additionally, data on the allocation of restoration funds and the progress of reconstruction works are systematically collected. The monitoring of restoration progress is conducted on a bimonthly basis, allowing for a detailed temporal assessment of the recovery process. Although this step aligns with the deterministic approach to resilience assessment [11-13], it introduces key innovations: (1) the collected data refer to the built heritage rather than critical infrastructure or lifeline systems, (2) the damage index is used as an indicator of functionality loss rather than a direct measure of functional disruption, and (3) the gradual restoration of the monument’s functionality is assessed based on the progress of the restoration works. Specifically, the damage index is progressively reduced as a function of the percentage of allocated funds effectively spent on restoring functionality.
2. Empirical Resilience Evaluation: In the second step, empirical resilience curves are derived for each church, following a deterministic approach to quantitatively assess engineering resilience [11-13]. However, this study introduces two pivotal novelties. First, the functionality loss after the earthquake is calculated by using the damage index id, providing an innovative metric for assessing post-earthquake degradation. Second, the recovery function is modelled based on financial investment, where the restoration progress is quantified according to the percentage of funds spent relative to the total allocated for the considered heritage building. This approach enables a more dynamic and resource-sensitive evaluation of resilience, distinguishing it from traditional methodologies.
3. Theoretical Resilience Evaluation: Since constructing detailed empirical resilience curves requires acquiring a substantial amount of data, which is not always available, the empirical data were used to calibrate and adapt theoretical formulations from the literature [10], which are generally applied to lifeline systems, to the context of Italian built heritage.
4. Calculation of the Global Resilience Index: For each analyzed heritage building, the average functionality over time is calculated, following the approach suggested by Bruneau et al. [2-3]. As an innovative contribution, this study introduces a Global Resilience Index, which quantifies the overall seismic resilience of the entire church system. Unlike traditional approaches, this index is computed by weighting the resilience contribution of each church in proportion to the percentage of funds allocated to its restoration, relative to the total funds assigned to the entire church system. This methodology provides a more representative measure of systemic resilience, highlighting the role of financial investment in post-disaster recovery at a network scale.
2.2 Comparison with Existing Approaches
Although previous studies have developed deterministic approaches to assess the resilience of lifeline systems and critical infrastructure [2-3, 11-13], these methods cannot be directly applied to buildings, particularly to the built heritage. This study overcomes this limitation by introducing the following innovative aspects compared to existing methodologies:
– Traditional approaches typically assess direct functional disruption, whereas this study models functional loss using the damage index id, offering an assessment of functionality directly related to the effects of the earthquake on the building.
– Existing models often assume standardized recovery functions, while the proposed methodology incorporates financial investment as a key driver of recovery, using the percentage of funds spent as a dynamic indicator of resilience.
– Previous applications of resilience indices do not consider heritage networks, whereas this study introduces a Global Resilience Index that quantifies systemic resilience across multiple heritage buildings, weighting each contribution based on allocated restoration funds.
3. Definition of the Resilience Curves
3.1 Data Collection
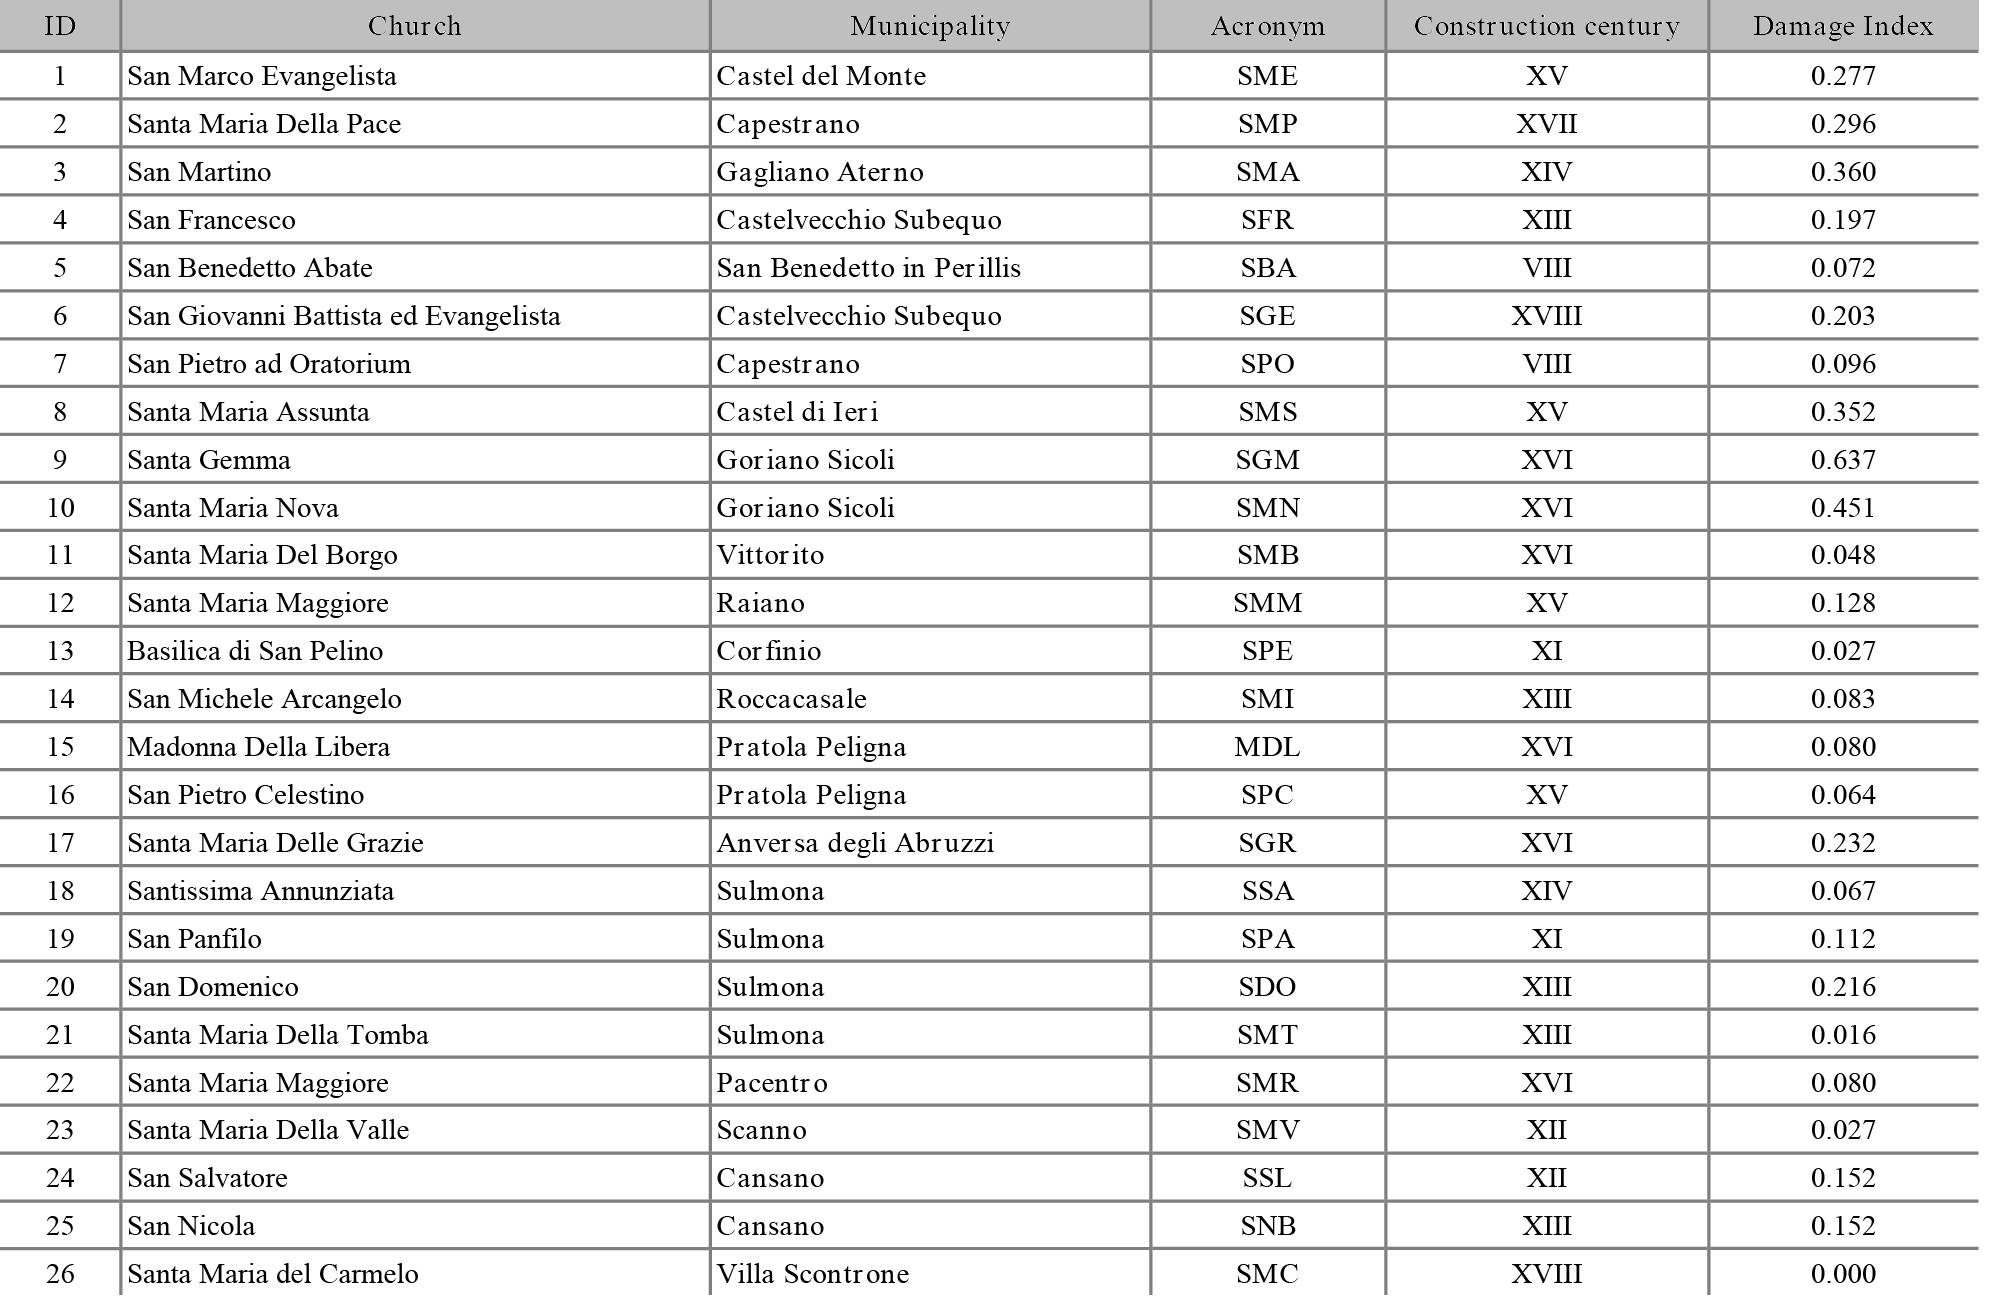
The first step in defining global resilience in a territorial context is a) to identify and locate the building systems to be analyzed and b) to assess the damage sustained by each building through the determination of a comprehensive damage index. In this work, a system of churches belonging to the Sulmona-Valva Diocese was analyzed. This diocese is located in the ecclesiastical province of L’Aquila (Italy) and includes 251 churches distributed across 49 different municipalities. The seismic damage sustained by masonry churches in the Sulmona-Valva Diocese after the 2009 L’Aquila earthquake was extensively analyzed by De Matteis et al. [18]. Their analysis focused specifically on three-nave churches, which represent 14% (26 buildings) of the total number of churches in the diocese. The selection of these churches was motivated by the substantial homogeneity found in terms of materials, geometric ratios, and architectural typology.
After examining the damage caused by the 2009 earthquake, De Matteis et al. [18] identified 28 damage mechanisms affecting the primary macro-elements of the analyzed churches (such as façade, colonnade, vaults, apse, transept, dome, and bell tower), in accordance with the Italian Code for the reduction of seismic risk of cultural heritage [19]. These mechanisms provide a comprehensive understanding of the vulnerabilities exhibited by various parts of the church structures during seismic events. De Matteis et al. [18] also defined six possible levels of damage, denoted as dk, ranging from 0 to 5. A level of dk = 0 indicates that no damage has occurred to the macro-element, or that the macro-element is not present, while dk = 5 represents a complete collapse of the macro-element. To provide an overall assessment, a global damage index id is assigned to each church analyzed, using the following equation, as suggested by [19]:
(1)
where (ρk,i) is a weight score, ranging from 0 to 1, based on the influence that the mechanism i has on the global structure stability. Table 1 identifies location, foundation period, acronym and damage index of each of the 26 churches of the Sulmona-Valva diocese examined by De Matteis et al. [18] and used in this work for the calculation of the resilience of the ecclesiastic system.
In order to obtain resilience curves for the individual churches, all information regarding public funding allocated by authorities for post-earthquake reconstruction was collected, including the start and completion dates of the works as well as the progress of the works at bimonthly intervals. The data were obtained by considering the reports of the funds allocated by the MiC (Ministero della cultura - Ministry of Culture) and work assignment decrees for the period before the year 2012 and, the bimonthly monitoring reports from the USRA (Ufficio Speciale Per la Ricostruzione dell’Aquila - Special Office for the Reconstruction of L’Aquila), for the period from 31/10/2013 to 30/06/2024 [20]. The USRA monitoring reports provide, for each funded intervention, the type of intervention, the cost, the first disbursement of funds, the estimated completion date, the implementation status (design, execution, testing, or completed intervention), and the percentage estimate of work progress. Where not specifically indicated, the initial fund disbursement has been considered as coinciding with the start of work.
Table 2 summarizes the information gathered for the churches listed in Table 1. Note that information on the funds received and the corresponding start date of work was available for only 16 of them. According to the information gathered in this study, other churches have not undergone any type of post-earthquake intervention, and for this reason, their resilience was not analyzed in this study. Specifically, Table 2 includes the project description along with the corresponding funding, the total cost of the intervention, the date of the initial funding, the completion date, and the estimated percentage of work completed for some of the monitored periods. This analysis revealed that some churches, such as San Francesco (SFR) in Castelvecchio Subequo Santa Maria Assunta (SMS) in Castel di Ieri, San Pelino (SPE) in Corfinio or San Pietro Celestino (SPC) in Pratola Peligna, were restored shortly before the earthquake, and no further consolidation interventions were planned. For other churches, again located in the province of L’Aquila, such as San Marco Evangelista (SME) in Castel del Monte or San Martino (SMA) in Gagliano Aterno, the restoration interventions have only recently begun, and the completion date remains unknown.
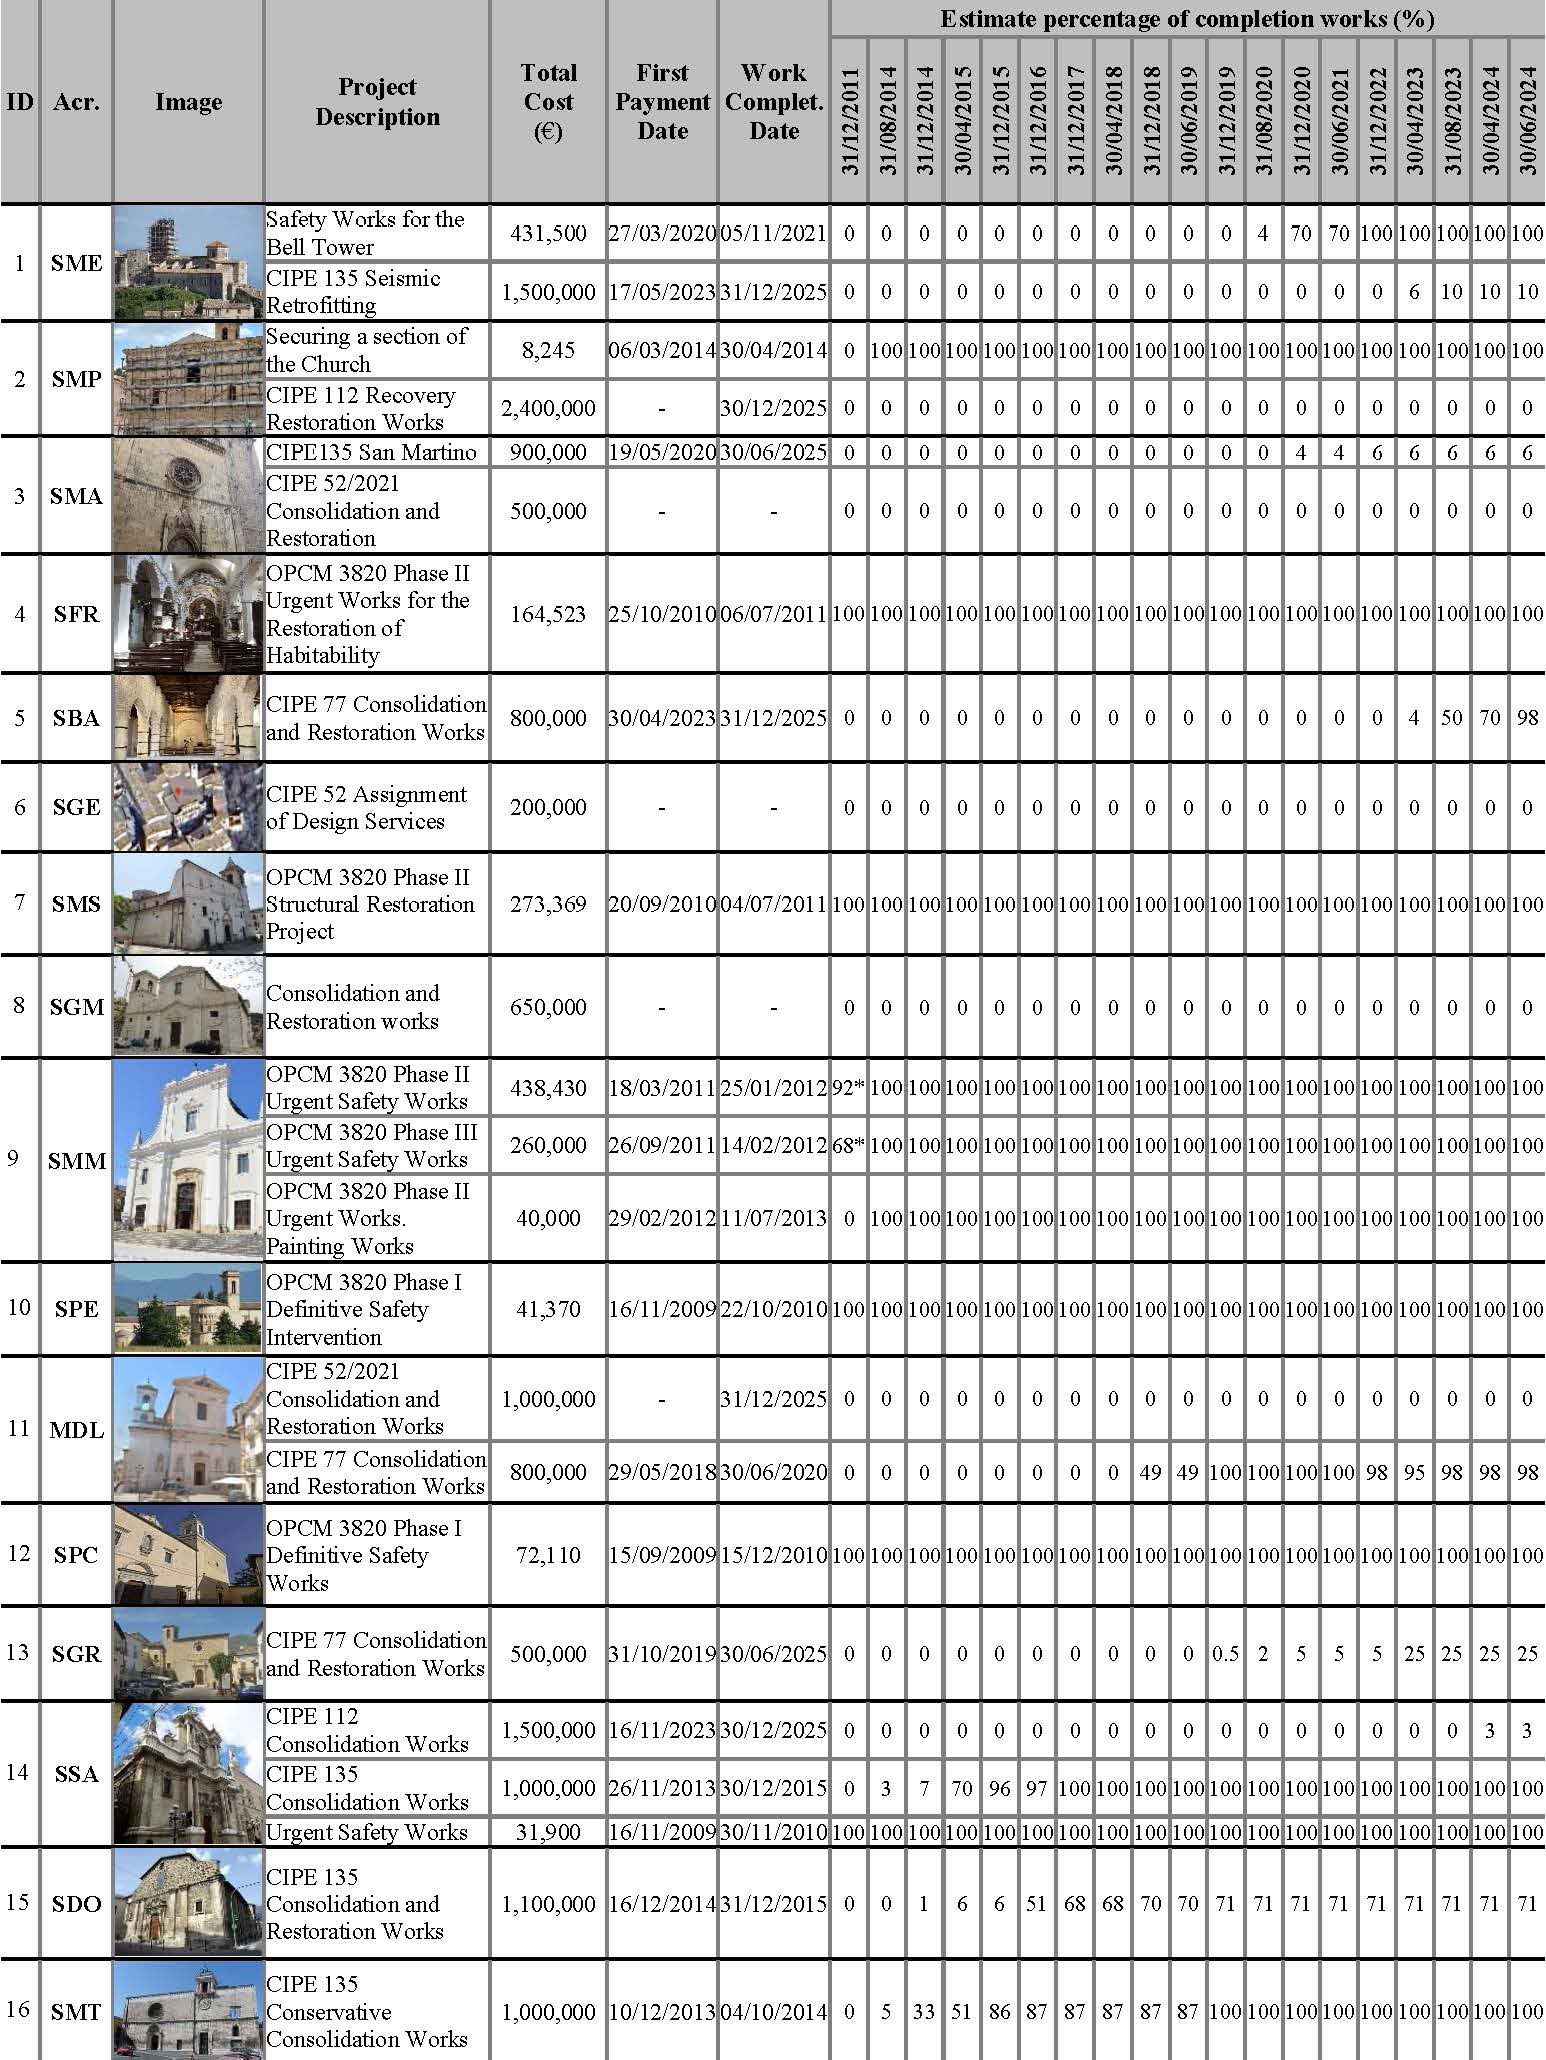
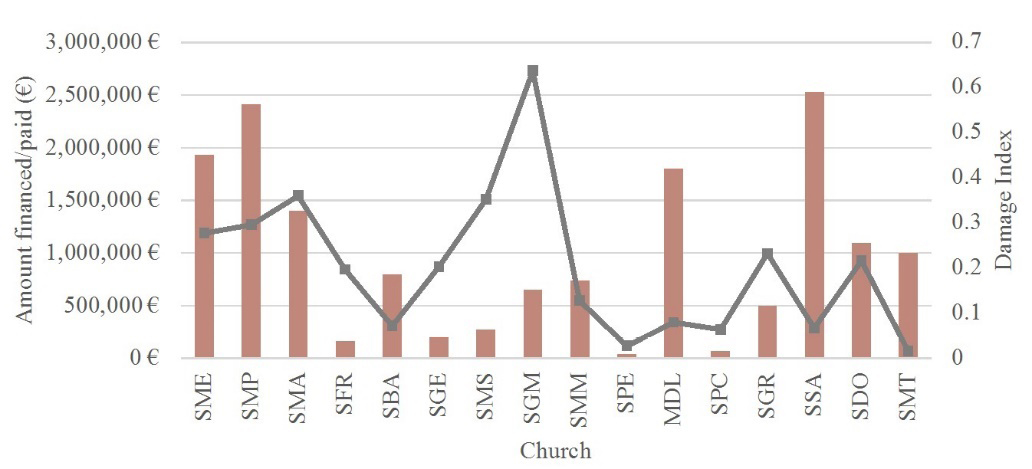
Table 2 also highlights that the allocated funds are not always proportional to the damage indices assessed after the 2009 L’Aquila earthquake. This discrepancy is shown in Figure 1, where, for each analyzed church, both the amount of allocated funds and the damage index following the 2009 earthquake are reported. It should be noted that the amount of funds allocated may depend more on the church’s historical and artistic value rather than solely on the damage index, reflecting specific choices in funding allocation.
3.2 Empirical Resilience
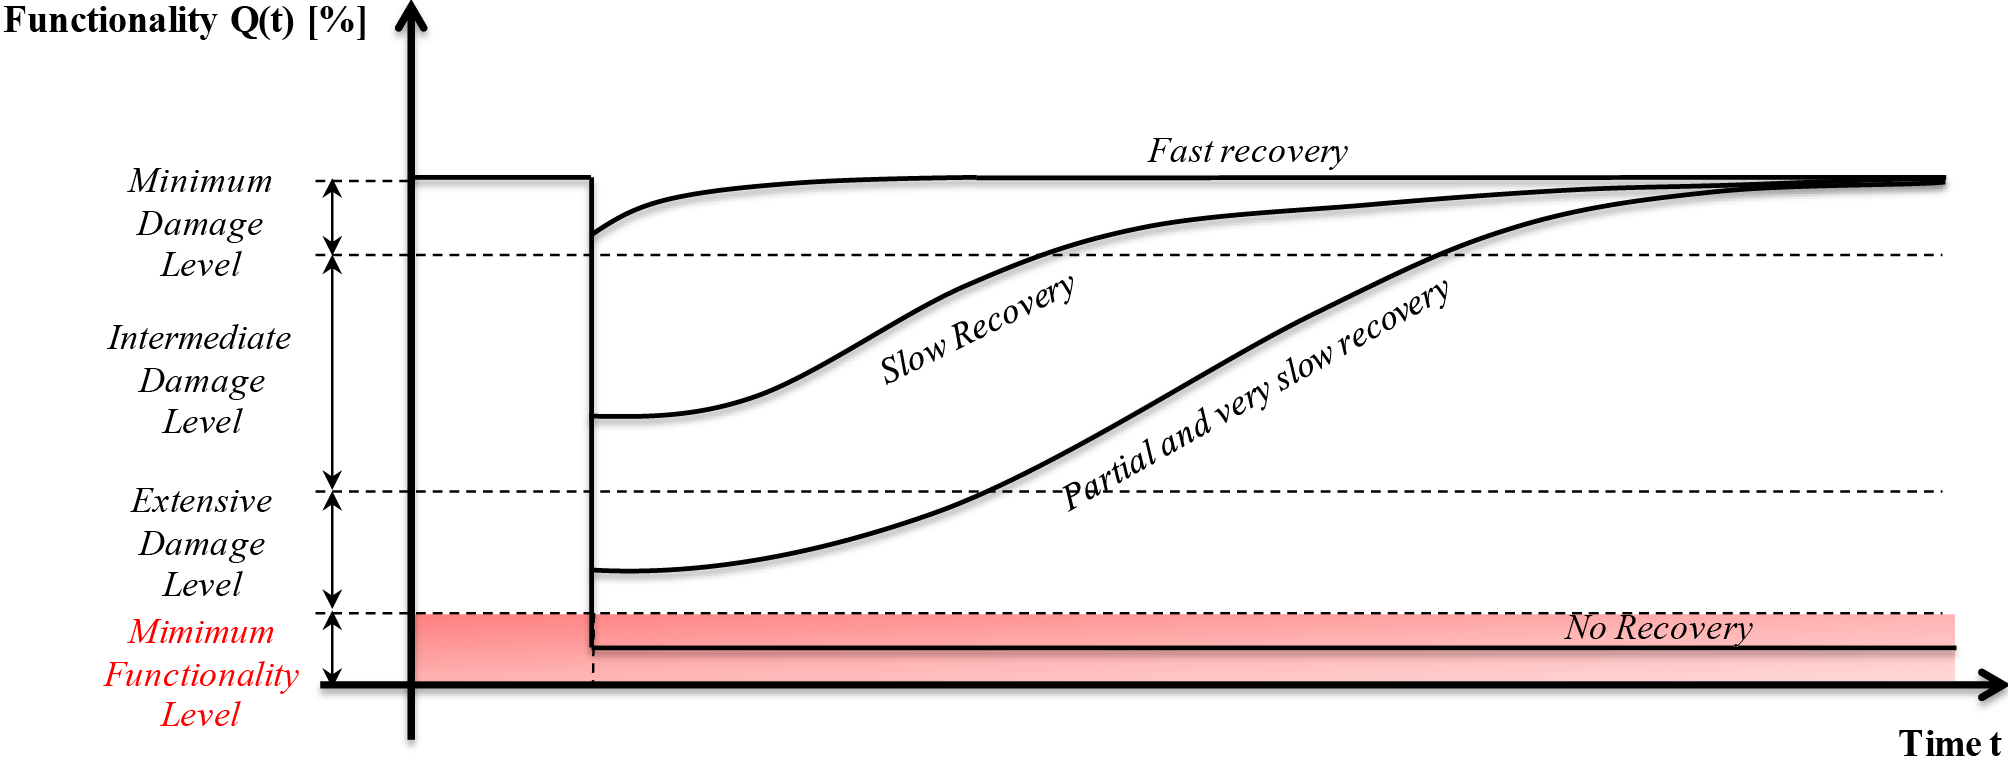
The resilience of a community, a system of buildings, or a single structure to a disastrous event can be represented through a curve. On the x-axis, there is the time t, starting from the catastrophic event (or immediately before), up to the period when the system has fully regained its original functionality. The y-axis represents the system functionality Q(t). Before the event, functionality is at 100%. When the event occurs, functionality drops sharply, followed by a recovery phase. The speed of recovery depends on the community’s recovery capacity, political choices, and availability of funds.
The data collected on the 16 churches analyzed and shown in Table 2 allowed for the plotting of their empirical resilience curves, characterized by data directly observed on-site (Figure 2). In this case, the date of the disastrous event corresponds to April 6, 2009, the date of the L’Aquila earthquake, and the points on the x-axis correspond to the dates when the progress of the works was monitored. The points on the y-axis, corresponding to the restoration of functionality, were derived based on the damage index id and the percentage of work completion. Specifically, at each time ti, id was scaled as a function of the corresponding percentage of work completion. In the case of churches undergoing multiple interventions, the damage index was scaled based on the cost of each intervention and its completion status. Subsequently, the functionality Q(ti) was calculated as indicated in Eq. 2. In this way, a null damage index id,ti corresponds to a functionality Q(ti) of 100%, while, for example, id,ti = 0.2 corresponds to Q(ti) = 80%.
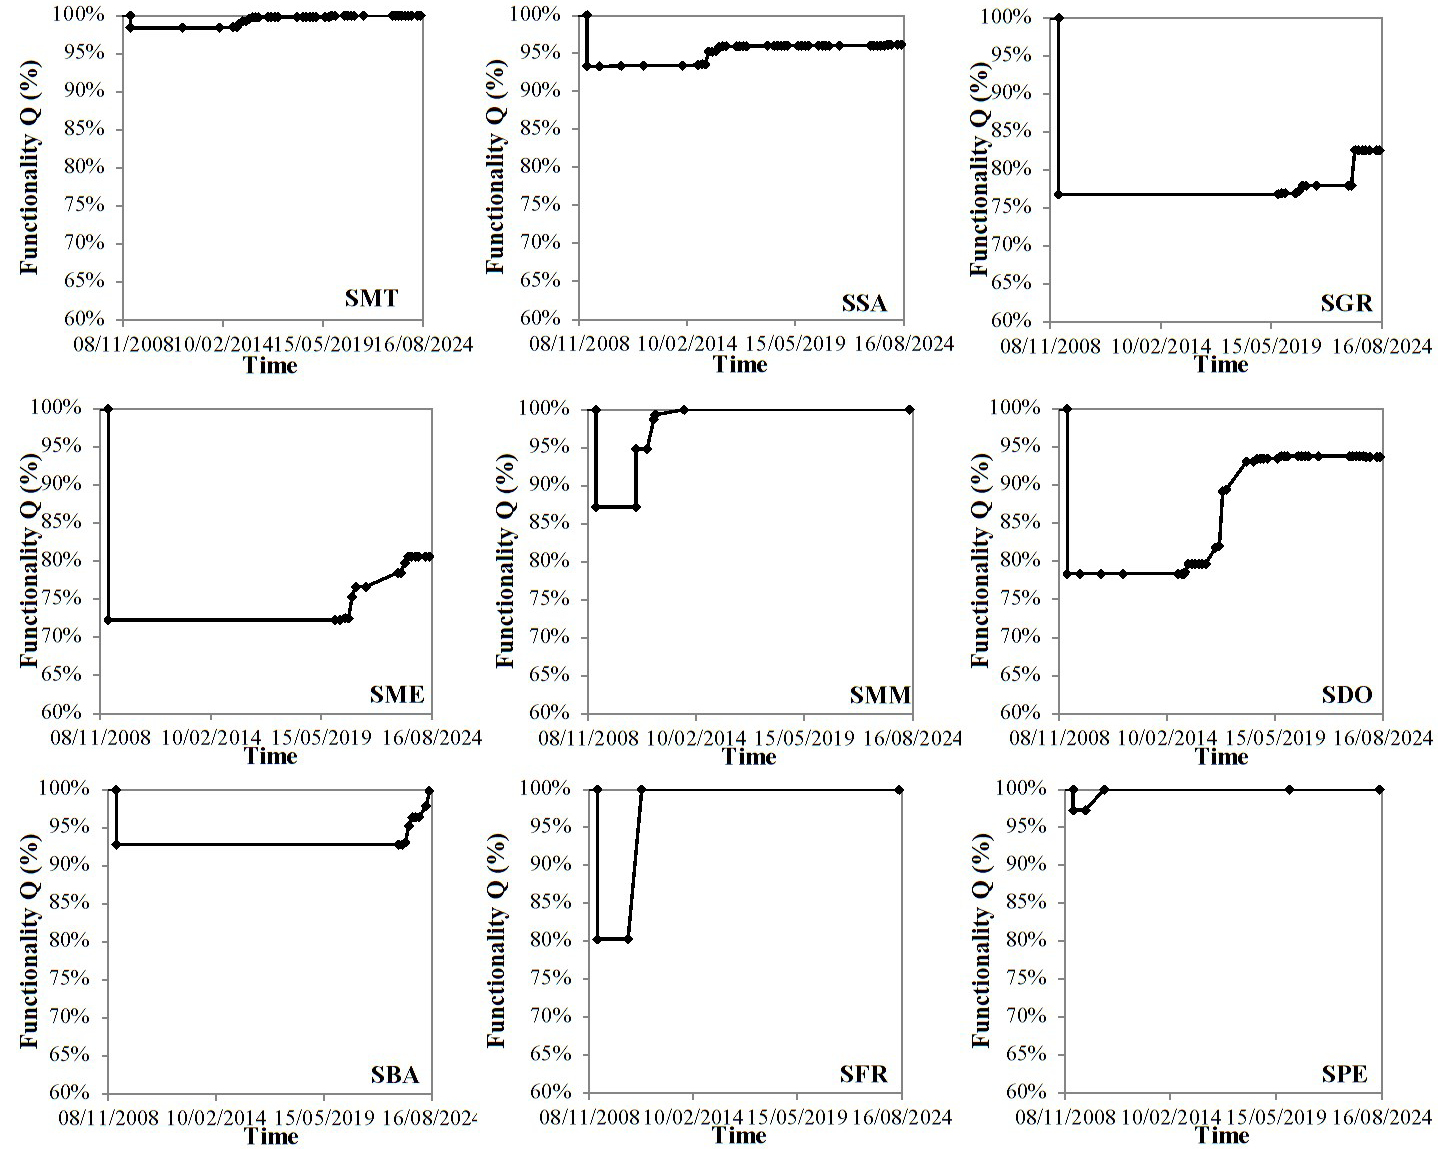
(2)
where Q(ti) is the functionality of the considered church at the time ti and id,ti is the corresponding damage index.
Figure 2 shows the empirical resilience curves for some of the churches listed in Table 2. These curves exhibit substantial and significant differences compared to the restoration curves found in the literature, which focus on different types of lifeline systems [11-13]. Specifically, in this case, there is a long period t between the occurrence of the event and the start of recovery and consolidation works, which can vary from a few years to over ten years. There are, in fact, churches that, more than 15 years after the event, have just started or have yet to begin restoration and consolidation works (SMA, SGE, SGM), despite the funds having been allocated long ago.
Generally, there is a minimum level of functionality below which structural recovery is no longer cost-effective, as the physical structure of the building has been damaged to such an extent that its original functionality can no longer be restored with an efficient cost-benefit ratio. In such cases, the structure is typically replaced with a new building serving the same functions as the original one. From a resilience perspective, this concept can be expressed as the presence of a Minimum Functionality (MF) Level, below which the structure is unable to recover its original function. Heritage buildings are characterized by very low or null MF coefficients, as their recovery is not determined by an optimal cost-benefit ratio but by the goal of preserving and passing cultural and historical heritage to future generations. In this study, none of the analyzed churches reached their MF coefficient, as the maximum observed damage after the 2009 L’Aquila earthquake was 0.637, according to [18].
3.3 Theoretical Resilience
Constructing detailed empirical resilience curves often demands a substantial volume of data, which may not be readily available for all contexts. To address this limitation, empirical data were leveraged to calibrate and adapt theoretical formulations commonly applied to lifeline systems to the unique characteristics of Italian built heritage. The use of a limited dataset calibrated with real data enables the estimation and comparison of resilience across various built heritage systems. This approach also supports the digitalization and automation of resilience assessment processes for entire systems, offering a replicable methodology.
The works of Cimellaro et al. [9-10], as well as studies using their method [e.g., 21-26] state that the recovery of a system can follow three different theoretical curves frec: (a) linear, (b) exponential [26] and (c) trigonometric [6]. The most basic approach is a linear recovery function (a), typically applied when no information is available on preparedness, resource availability, or societal response. An exponential recovery function (b) may be suitable when an initial influx of resources is present, with the recovery rate gradually slowing as the process nears completion. A trigonometric recovery function (c) can be used when societal response and recovery are limited by a lack of organization and/or resources
(3)
where frec is the recovery function, which is the complement of Q(t), a is the global damage index of the considered church after the earthquake, b is a constant value calculated using curve fitting to available data sources, t0E is the instant of time when the earthquakes occur, and TRE is the recovery time necessary to go back to pre-disaster condition evaluated starting from t0E.
The type of recovery curve is influenced not only by the specific characteristics of the system but also, and more importantly, by the level of damage caused by the earthquake. When a structure experiences minimal damage, its recovery is typically rapid and follows an exponential curve over a short period of time. Conversely, when a structure suffers extensive or moderate damage, the recovery of its original functionality is likely to be slow and follows a trigonometric curve. Figure 3 shows the recovery curves as a function of the damage level caused by the seismic event, as well as the minimum functionality level below which the original system is generally not restored.
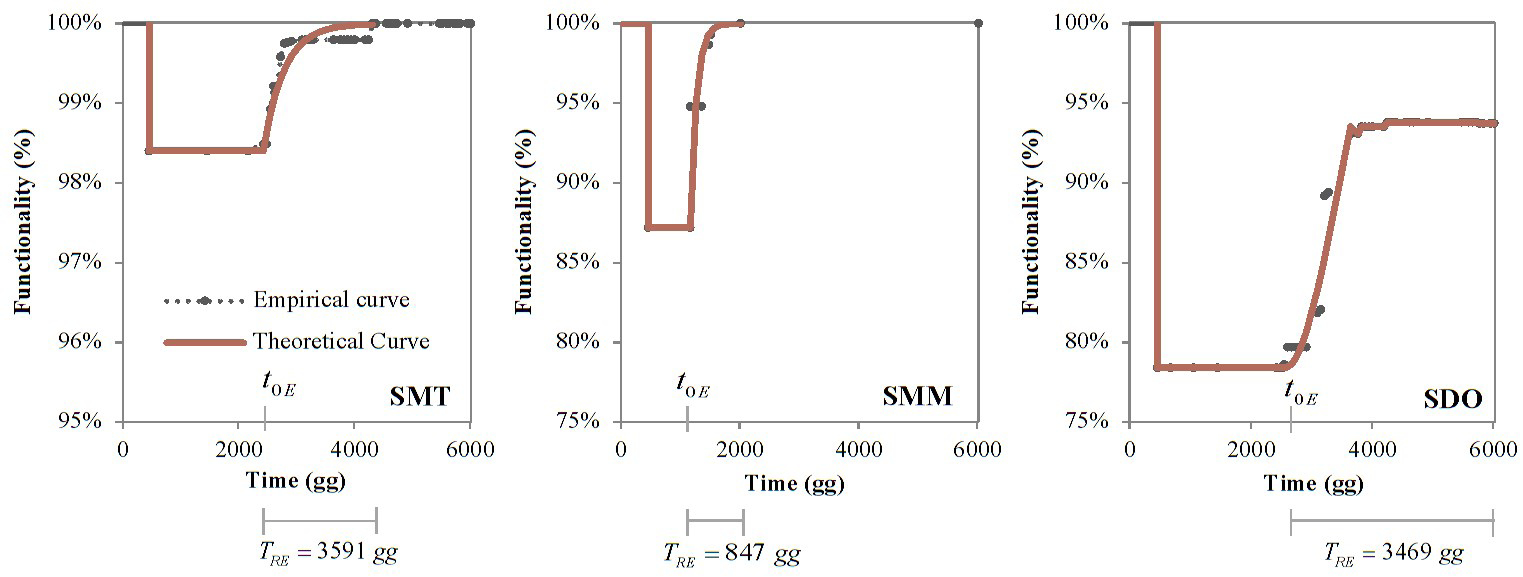
The empirical resilience curves shown in Figure 2 were compared with the theoretical resilience curves. This comparison was adapted to the Italian context by adjusting the theoretical approach presented in Figure 3. Typically, a disruptive event is immediately followed by the reconstruction process; however, in the case of the three-nave churches in the Sulmona-Valva Diocese, there is an extended delay between the L’Aquila earthquake and the start of recovery efforts. Consequently, Equations 3a, 3b and 3c were applied by setting t0E to the date when securing, consolidation, or restoration work began on the churches, rather than the instant when the earthquake occurred. For instance, Figure 4 displays comparisons between the empirical and theoretical resilience curves for some of the analyzed churches. It is observed that this adjustment to t0E enables the empirical resilience curves to align with the theoretical ones. This alignment suggests that, even without continuous monitoring of the reconstruction progress, a resilience curve can be hypothesized based on the known end of the works and the period between the destructive event and the start of reconstruction, allowing for the derivation of the corresponding resilience index, which is equal to the area under the curve.
3.4 Global Resilience Index
To develop a global resilience index, it is first essential to determine the average functionality over time for each church. Each church’s resilience curve represents its functionality Q(t) as a function of time t. By calculating the average functionality over the observation period (i.e. the area under the functionality curve), a representative measure of each church’s resilience is obtained:
(4)
where Qi(t) denotes the functionality of church i at time t, and T represents the total observation period (from the earthquake occurrence to the completion of restoration).
The resilience of the single heritage building is calculated as a percentage. A resilience of 100% indicates that the heritage structure did not sustain damage from the disruptive event, or that no damage occurred. Conversely, a resilience of 0% indicates a total collapse of the historical building, with no intent or possibility of restoring the lost functionality. For example, a resilience of 50% may correspond to a damage index of 1, while higher resilience values correspond to progressively lower damage indices. Resilience is calculated as the area under the curve, normalized over the observation period T. Therefore, for the same disruptive event, if the restoration start, recovery function, and damage index remain unchanged, the resilience value is the same whether T is 10 or 20 years. When the start date of restoration does not coincide with the disruptive event, the recovery curve does not begin immediately after the event but at the start of the restoration work. Nevertheless, resilience is always calculated as the area under the Q(t) curve between the disruptive event and the completion of work. Where there is no completion date, the reference point is the date of the last monitoring.
In developing a Global Resilience Index that reflects the overall seismic resilience of the church system, this study introduces a novel approach: weighing the resilience contributions of individual churches based on the funds allocated for their restoration. This methodology leverages the assumption that higher restoration funding correlates with greater historical, cultural, or social importance, offering an indirect but pragmatic indicator of priority. In existing literature, resilience indices often rely on factors such as structural vulnerability, geographic location, or specific damage assessments as primary criteria for weighing resilience elements (see, for instance, methodologies by Cimellaro et al. [14-15] in the PEOPLES framework apply a resilience-based design in urban settings). However, this approach does not account for the significance of cultural heritage in resilience, nor does it directly incorporate financial considerations as a reflection of priority.
For each church i, a weight Wi proportional to the allocated restoration funds Fi was assigned:
(5)
where the sum of weights equals 1. This weighted approach provides a Global Resilience Index (Rglobal) calculated in percentage terms as:
(6)
where Qi represents the average functionality over time for each church, expressed as a percentage. By adopting restoration funding as a weighting factor, this study aligns resilience calculations with practical, real-world considerations, enhancing the representation of both recovery dynamics and cultural importance. This approach also supports resource allocation strategies that align with both structural resilience and heritage conservation.
3.5 The Global Resilience Index Application
The Global Resilience Index for the three-nave masonry churches in the Sulmona-Valva area was calculated using theoretical resilience curves for 12 churches from a dataset of 26 with sufficient data. As previously mentioned, in the absence of sufficient data, it is possible to calculate theoretical resilience. To demonstrate the potential of this approach, the theoretical model was validated by assuming the absence of certain data and then compared with the empirical calculation. The calculated resilience, weighted according to the allocated restoration funds, resulted in a value of 88.5%, reflecting a generally high resilience of Abruzzo’s churches to seismic events.
The procedure was repeated by constructing theoretical resilience curves without accounting for the time between the destructive event and the start of restoration, while maintaining the same completion date, percentage of work completed, and resilience function. This approach allowed for the calculation of an ideal resilience index of 90.8%. It should be noted that in this case, the same completion date was maintained. If, instead, the duration of the consolidation works is kept constant by eliminating the delay between the destructive event and the start of works – thus moving the completion date earlier – the resilience became equal to 94.2%. These results emphasize the impact of timely resource allocation by public authorities, illustrating how more immediate interventions can substantially enhance the resilience of cultural heritage.
4. Digitization of Resilience Curves
4.1 Digitization workflow
The digitization workflow for assessing the seismic resilience of heritage buildings follows a systematic approach that integrates data collection, analysis, dynamic visualization and strategic planning into a coherent framework. This workflow focuses on an automated data management system tailored to resilience assessment. It is designed to guide the entire process, from gathering initial damage data to implementing a dynamic digital platform for ongoing management and resilience planning. The goal is to provide a scalable and adaptable tool for monitoring restoration progress, quantifying resilience indices, and supporting decision-making for conservation strategies.
The workflow is divided into five main stages, from raw data collection to digital representation and resilience assessment:
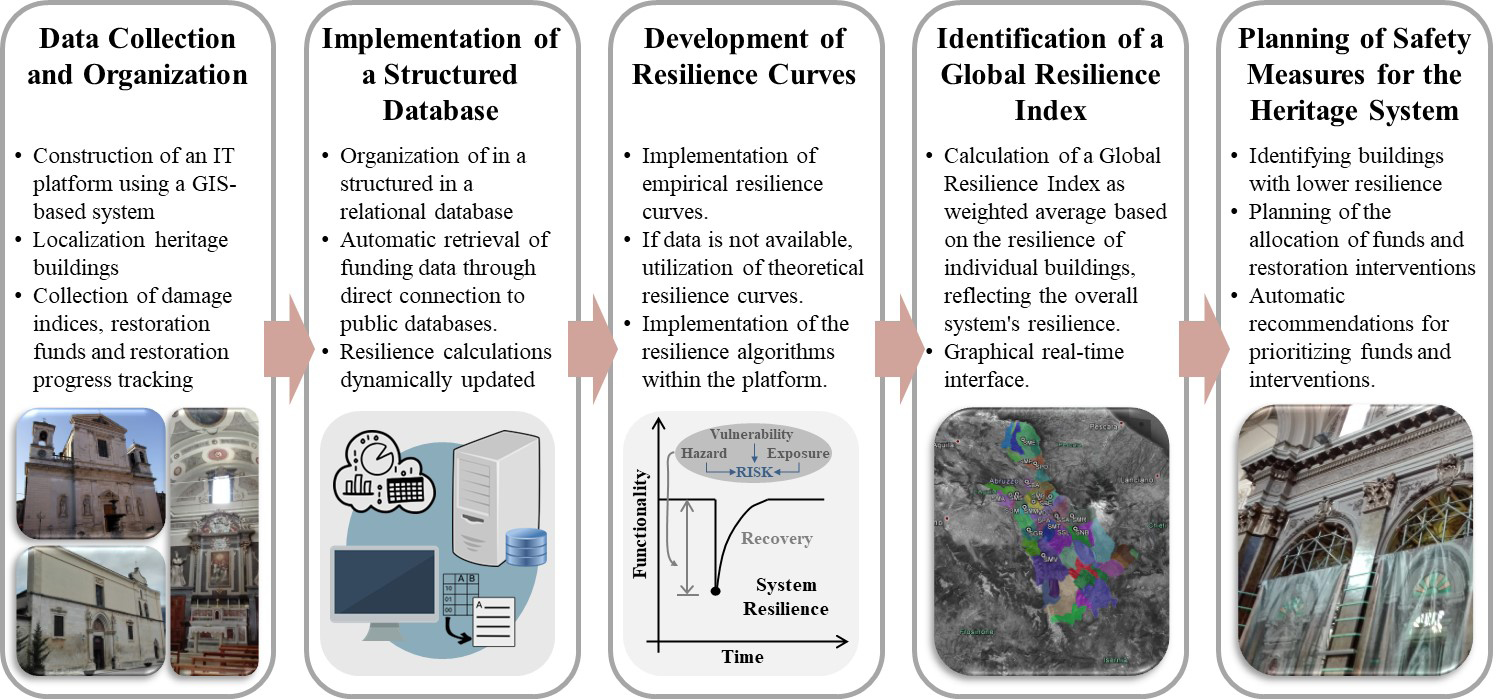
– Data Collection and Organization. A georeferenced Innovative Technology (IT) platform is constructed using a system based on Geographic Information System (GIS) to spatially organize and visualize resilience data. This platform allows for the precise localization of each heritage building and the collection of relevant information, including post-earthquake damage indices, allocated restoration funds and restoration progress tracking, conducted on specific time intervals for precise monitoring.
– Implementation of a Structured Database. Data is structured in a relational database, where each church identification (ID) serves as a unique reference, enabling continuous monitoring of the building’s resilience evolution. To ensure real-time updates, the system is designed to interface directly with public databases that publish information on allocated restoration funds (e.g. [20]). This integration allows for automated retrieval of funding data, ensuring that resilience calculations remain dynamically updated as new funding rounds are approved or disbursed.
– Development of Resilience Curves. Empirical resilience curves are constructed based on the percentage of completed restoration work. In cases where data is not available, theoretical resilience curves are developed using average data from similar churches, with the potential application of machine learning algorithms to enhance predictive accuracy. At this stage, analyses are conducted at the building scale, and algorithms are implemented within the platform to dynamically plot resilience curves, ensuring real-time assessment.
– Identification of a Global Resilience Index. The Rglobal index is calculated as a weighted average based on the resilience of individual buildings and the funds allocated for their restoration, reflecting the overall system’s resilience. In this case, a territorial scale is used to provide the resilience dynamics of the overall heritage system, which are displayed in a graphical real-time interface.
– Planning of Safety Measures for the Heritage System. Based on the resilience analysis, this final stage focuses on identifying buildings with lower resilience so that policymakers and stakeholders can adequately and reasonably plan the allocation of funds, safety measures, or restoration interventions needed. To assist this process, the system can provide recommendations for prioritizing funds, security measures, and interventions upon request, ensuring optimal heritage preservation strategies.
Figure 5 provides a visual representation of the digitization workflow, highlighting each stage and illustrating how data flows from collection to analysis and implementation. Each step is interconnected, and each piece of information is essential to the next step, supporting an efficient resilience strategy for heritage buildings.
4.2 Limitations and future directions
From an operational perspective, the web-based platform and digitization workflow can vary in complexity. For instance, the algorithm for identifying resilience can be implemented on a basic platform, working as an Excel sheet, where specific details for each church ID are recorded.
On the other hand, a more advanced platform, which could be developed through future research, would significantly enhance functionality. The proposed georeferenced computing platform and GIS-based system outlined in this study represent a conceptual framework for future implementation, aimed at improving data integration, automation, and visualization capabilities. Once fully developed, this system would enable automated calculations, real-time data retrieval from public databases, and dynamic visualization of resilience metrics, providing a scalable and adaptive tool for heritage conservation strategies.
5. Conclusions
This paper presents a comprehensive approach to assessing the resilience and operability of heritage churches impacted by the 2009 L’Aquila earthquake. The proposed workflow integrates systematic data collection, empirical and theoretical resilience curve development, and a global resilience index calculation to support informed decision-making and enhance resilience planning.
The key aspects covered in this paper and the innovative contributions include:
(a) The quantitative calculation of resilience for cultural heritage, addressing the gap in the existing scientific literature related to quantitative resilience studies, which have primarily focused on lifeline systems and, more recently, on schools.
(b) The development of empirical resilience curves based on restoration funding allocation and the monitoring of work progress, offering a novel perspective on how financial resources impact resilience.
(c) The comparison and calibration of empirical and theoretical resilience curves, including the adaptation of theoretical models to cultural heritage cases. Constructing detailed empirical resilience curves often requires substantial data, which may not always be available. To address this, empirical data were used to calibrate theoretical resilience functions, adapted from lifeline systems to the unique characteristics of Italian built heritage. This approach enables the estimation and comparison of resilience across heritage systems, supports the digitization and automation of resilience assessments, and provides a replicable methodology.
(d) The calculation of a global resilience index, which aggregates the resilience of individual churches, weighted by the allocated restoration funds, reflecting both their physical resilience and their cultural and historical significance. These results highlight the critical role of timely resource allocation by public authorities, demonstrating how prompt interventions can significantly enhance the resilience of cultural heritage.
(e) The creation of a digitization workflow designed to facilitate easy resource allocation and intervention planning, ultimately improving the resilience of built heritage and preparing it for potential disruptive events.
Overall, the findings demonstrate that the proposed framework not only advances current methodologies for resilience assessment but also provides a practical tool for enhancing the preparedness of heritage buildings for disruptive events. Future research could integrate this approach with advanced predictive technologies, such as machine learning, to further enhance resilience modeling and improve accuracy.
6. Acknowledgements
The authors would like to thank the Digital Fabrication Lab of the INGEO Department at the D’Annunzio University of Chieti–Pescara, where the work was developed, for providing essential support and resources that contributed to the successful completion of this study. Special thanks are also extended to De Matteis et al. [18], whose study provided a fundamental reference for the development of this research.
7. Funding
The study presented in this article was supported by the following projects:
– GENESIS: Seismic risk manaGEmeNt for the touristic valorisation of thE hiStorIcal centers of Southern Italy with a consortium of 20 partners, founded by the National Operative Programme. PON MIUR “Research and Innovation” 2014–2020 and FSC. D.D. 13/07/2017 n. 1735. Industrial research and experimental development projects in the 12 Smart Specialization areas. Specialization area: Cultural Heritage. Project Code ARS01_00883.
– INTERCONNECTING: Data, Analysis, and Digital Immersive Models for Sustainable Conservation of the Built Heritage: risk assessment and proactive strategies. PNRR-Next Generation EU—1.3 Extended partnerships—CHANGES Spoke 7—Protection and conservation of cultural heritage against climate changes, natural and anthropic risks. Leader: University of Florence CUP B53C22004010006. Topic: Data processing and digital modeling.
– MULTI-TWIN: Intelligenza artificiale a supporto di analisi Multi-rischio mediante digital-Twin. PNRR-Next Generation EU—1.4 National Centers. Mission 4, “Education and Research”—Component 2, “From Research to Enterprise”— Investment Line 1.4, Project ‘National Centre for HPC, Big Data and Quantum Computing—HPC’ CUP H93C22000450007. Topic: Application of AI, data analysis and virtual reality for monitoring and management of infrastructure and resources as well as multi-hazard analysis at a regional scale with a focus on historic centers, critical buildings and environments (i.e., forests).
The opinions and conclusions presented by the authors do not necessarily reflect those of the funding agencies.
8. Author contributions
Cristina Cantagallo: Conceptualization (lead), Data Curation, Formal Analysis, Methodology (lead), Software (supporting), Validation (lead), Visualization, Writing – Original Draft Preparation (lead), Writing – Review & Editing (equal). Valentino Sangiorgio: Conceptualization (supporting), Software (lead), Methodology (supporting), Supervision, Validation (supporting), Writing – Original Draft Preparation (supporting), Writing – review and editing (equal).
9. References
[1] Hosseini S, Barker K, Ramirez-Marquez JE (2016) A review of definitions and measures of system resilience. Reliab Eng Syst Saf 145:47–61. https://doi.org/10.1016/j.ress.2015.08.006
[2] Bruneau M, Chang SE, Eguchi RT, Lee GC, O’Rourke TD, Reinhorn AM, Shinozuka M, Tierney K, Wallace WA, Von Winterfeldt D (2003) A Framework to Quantitatively Assess and Enhance the Seismic Resilience of Communities. Earthquake Spectra 19(4):733–752. https://doi.org/10.1193/1.1623497
[3] Bruneau M, Reinhorn AM (2007) Exploring the concept of seismic resilience for acute care facilities. Earthquake Spectra 28(1):41–62. https://doi.org/10.1193/1.2431396
[4] De Iuliis M, Cardoni A, Cimellaro GP (2024) Resilience and safety of civil engineering systems and communities: a bibliometric analysis for mapping the state-of-the-art. Saf Sci 174:106470. https://doi.org/10.1016/j.ssci.2024.106470
[5] Chang SE, Shinozuka M (2004) Measuring improvements in the disaster resilience of communities. Earthquake Spectra 20(3):739–755. https://doi.org/10.1193/1.1775796
[6] Youn BD, Hu C, Wang P (2011) Resilience-driven system design of complex engineered systems. J Mech Des 133(10). https://doi.org/10.1115/1.4004981
[7] Ayyub BM (2014) Systems resilience for multihazard environments: definition, metrics, and valuation for decision making. Risk Anal 34(2):340–355. https://doi.org/10.1111/risa.12093
[8] Franchin P, Cavalieri F (2015) Probabilistic assessment of civil infrastructure resilience to earthquakes. Comput-Aided Civ Infrastruct Eng 30(7):583–600. https://doi.org/10.1111/mice.12092
[9] Cimellaro GP, Reinhorn AM, Bruneau M (2010) Framework for analytical quantification of disaster resilience. Eng Struct 32(11):3639–3649. https://doi.org/10.1016/j.engstruct.2010.08.008
[10] Cimellaro GP, Reinhorn AM, Bruneau M (2010) Seismic resilience of a hospital system. Struct Infrastruct Eng 6(1-2):127–144. https://doi.org/10.1080/15732470802663847
[11] Dueñas-Osorio L, Kwasinski A (2012) Quantification of lifeline system interdependencies after the 27 February 2010 Mw 8.8 offshore Maule, Chile, earthquake. Earthquake Spectra 28(1_suppl1):581–603. https://doi.org/10.1193/1.4000054
[12] Cimellaro GP, Solari D, Bruneau M (2014) Physical infrastructure interdependency and regional resilience index after the 2011 Tohoku Earthquake in Japan. Earthquake Eng Struct Dyn 43(12):1763–1784. https://doi.org/10.1002/eqe.2422
[13] Cimellaro GP, Solari D (2014) Considerations about the optimal period range to evaluate the weight coefficient of coupled resilience index. Eng Struct 69:12–24. https://doi.org/10.1016/j.engstruct.2014.03.003
[14] C S Renschler, A E Frazier, L A Arendt, G P Cimellaro, A M Reinhorn, M Bruneau (2010) Developing the ‘PEOPLES’ resilience framework for defining and measuring disaster resilience at the community scale. https://doi.org/10.13140/RG.2.1.1563.4323
[15] Cimellaro GP, Renschler C, Reinhorn AM, Arendt L (2016) PEOPLES: a framework for evaluating resilience. J Struct Eng 142(10):04016063. https://doi.org/10.1061/(ASCE)ST.1943-541X.000151
[16] Cantagallo C, Cianchino G, Sangiorgio V, Masciotta MG, Pierantozzi M, Lops C, Di Loreto S, Brando G, Spacone E (2024) GENESIS: a web-based platform for managing the seismic risk of historic centres of Southern Italy. In: Proceedings of the 10th Euro-American Congress REHABEND 2024, Gijón, 7–10 May 2024, pp 2522–2530
[17] Cantagallo C, Sangiorgio V (2025) An IT Tool for Managing Seismic Risk and Energy Performance of the Building Stock in Southern Italy. In: Corrao R, Campisi T, Colajanni S, Saeli M, Vinci C (eds) Proceedings of the 11th International Conference of Ar.Tec. (Scientific Society of Architectural Engineering). Springer Nature Switzerland, Cham, pp 103–114
[18] De Matteis G, Criber E, Brando G (2016) Damage probability matrices for three-nave masonry churches in Abruzzi after the 2009 L’Aquila earthquake. Int J Archit Herit 10(2–3):120–145. https://doi.org/10.1080/15583058.2015.1113340
[19] DPCM (2011) Direttiva del Presidente del Consiglio dei Ministri 9 febbraio 2011. Valutazione e riduzione del rischio sismico del patrimonio culturale con riferimento alle Norme tecniche per le costruzioni di cui al D.M. 14/01/2008. Gazzetta Ufficiale n. 47, Suppl. Ordinario n. 54, 26/06/2011 (in Italian)
[20] USRA Ufficio Speciale per la Ricostruzione dell’Aquila (2024) Ricostruzione dell’Aquila a seguito del sisma del 6 Aprile 2009. Presidenza del Consiglio dei Ministri. https://www.usra.it. Accessed Nov 2024
[21] Forcellini D (2021) The role of climate change in the assessment of the seismic resilience of infrastructures. Infrastructures 6(5):76. https://doi.org/10.3390/infrastructures6050076
[22] Singhal TK, Kwon OS, Bentz EC, Christopoulos C (2021) Development of a civil infrastructure resilience assessment framework and its application to a nuclear power plant. Struct Infrastruct Eng 18(1):1–14. https://doi.org/10.1080/15732479.2020.1832538
[23] Shang Q, Wang T, Li J (2022) A quantitative framework to evaluate the seismic resilience of hospital systems. J Earthquake Eng 26(7):3364–3388. https://doi.org/10.1080/13632469.2020.1802371
[24] Carofilis Gallo WW, Clemett N, Gabbianelli G, O’Reilly G, Monteiro R (2022) Seismic resilience assessment in optimally integrated retrofitting of existing school buildings in Italy. Buildings 12(6):845. https://doi.org/10.3390/buildings12060845
[25] Hu B, Li S, Hou Z, Zhai C (2024) A practical method for functional recovery analysis based on seismic resilience assessment of city building portfolios. Journal of Building Engineering 95:110304. https://doi.org/10.1016/j.jobe.2024.110304
[26] Li P, Li X, Wang X, Wang D (2023) Seismic resilience evaluation of reinforced concrete frame considering the effect of mainshock-aftershock sequences. Appl Sci 13(23):12620. https://doi.org/10.3390/app132312620
[27] Kafali C, Grigoriu M (2005) Rehabilitation decision analysis. In: Augusti G, Schuëller GI, Ciampoli M (Eds) Proceedings of ICOSSAR’05 — 9th International Conference on Structural Safety and Reliability, Rome, 2004