Artificial Intelligence for Detecting Surface Alteration Phenomena in Stone-Built Heritage: The Case of the ‘Unfinished Church’ of Venosa
1 Department of Civil, Environmental, Land, Construction and Chemistry, Politecnico di Bari, Italy
2 Department of Mechanical Engineering and Industrial Design, Universidad de Cádiz, Spain
Email: michele.buldo@poliba.it; fabio.fatiguso@poliba.it; elena.cabrera@uca.es; cesare.verdoscia@poliba.it
*Corresponding author
Abstract. Point clouds and 3D models have become essential not only for the digitisation process but also for the non-invasive assessment of deterioration and potential decay mapping in Cultural Heritage, particularly in the built environment and architectural landmarks. These resources facilitate precise digital inspections and enable a comprehensive analysis of the morphological and material properties of heritage assets, in strict alignment with conservation principles. Recent advancements in Artificial Intelligence have further refined 3D data and image processing, introducing sophisticated techniques for segmentation and classification through both supervised and unsupervised learning paradigms. Building upon these breakthroughs, this study explores the semi-automatic identification of surface alterations in the stone masonry of the south-east façade of the ‘Unfinished Church’, which is part of the Most Holy Trinity Complex in Venosa (Southern Italy). The mapping process started with the photogrammetric point cloud, employing RGB colour-detection techniques, followed by the implementation of two Machine Learning algorithms (Fast Random Forest and K-Nearest Neighbours) to examine the UV texture of the polygonal model. Comparative analyses, both quantitative and qualitative, were conducted to assess the effectiveness of these methods in identifying and classifying alterations, highlighting their potential to support preservation efforts and guide future maintenance strategies.
Keywords: Artificial Intelligence, Built Heritage, Image Processing, Point Cloud, Surface Alteration.
1. Introduction
Cultural Heritage (CH) encompasses the tangible and intangible expressions of human history, including traditions, artworks, documents, and archaeological sites. Among its tangible aspects, Built Heritage (BH) holds a crucial role, comprising historic buildings, monuments, and architectural structures that reflect the achievements, identities, and narratives of past societies [1-2]. The preservation of BH has become a critical global priority, particularly in light of the accelerating impacts of climate change, environmental degradation, natural disasters, and human activity [3-4].
In response to these challenges, advancements in digital technologies have revolutionised CH documentation and analysis, with 3D point clouds – generated through photogrammetry or LiDAR – emerging as essential tools [5-6]. These datasets, composed of millions of spatially referenced points enriched with radiometric attributes such as RGB colour and reflectance intensity, enable highly detailed geometric reconstructions and material properties. When integrated with textured 3D models, point clouds not only advance the digitisation of heritage but also serve as powerful non-invasive tools for diagnosing surface and structural degradation and informing conservation strategies.
Concurrently, the application of Artificial Intelligence (AI) has catalysed substantial progress in the analysis of CH datasets [7], harnessing state-of-the-art techniques in image and point cloud processing [8, 9]. These AI-driven methodologies have demonstrated exceptional efficacy in the automatic recognition of colour and texture patterns, enabling the detection of surface alteration and degradation phenomena. Machine Learning (ML) algorithms – such as Random Forest (RF), K-Nearest Neighbours (K-NN), Support Vector Machines (SVM), and more – along with advanced Deep Learning (DL) techniques – like PointNet, Dynamic Graph Convolutional Networks (DGCNN), or the recently introduced Segment Anything Model (SAM) – have become integral to these tasks [10-11].
By leveraging feature extraction techniques, these methods effectively segment and classify data based on chromatic anomalies, reflectance patterns, and geometric inconsistencies, enhancing the accuracy and precision of analysis [12-13]. The integration of colour-based approaches, which assign distinct RGB colours to regions of interest within the point cloud, enables the rapid detection of altered areas and deterioration patterns. This methodology is particularly powerful when combined with texture-based techniques, such as orthophotos or UV maps [14-15], for the semi-automatic identification of cracks, erosion, and other forms of material degradation, such as in stone, thus providing a comprehensive and reliable evaluation of both surface and structural conditions [16-17].
Moreover, AI has made considerable strides in the automatic recognition and differentiation of architectural elements, such as columns, arches, and façades, within point clouds. This ability to segment and classify architectural features contributes significantly to our understanding of the complex geometry of historic buildings [18, 19]. These methodologies enhance the accuracy of segmentation and classification of point clouds, even when datasets are incomplete or only partially annotated. This is particularly significant for advancing the Scan-to-BIM process, which involves the semi-automatic conversion of semantic point clouds into Building Information Models (BIM) [20], with the model also incorporating data derived from degradation analysis [21].
Although AI presents significant opportunities for conservation in the built environment, its application raises ethical challenges, including data bias and the marginalisation of human expertise. To uphold authenticity and ethical integrity, AI should complement, rather than replace, human judgment [22-23].
1.1 Aims of the Research
Following the insights of a previous study [15], this research represents a significant advancement in the development of semi-automatic methodologies for mapping surface alterations on Stone-Built Heritage. Focusing on the south-east façade of the Unfinished Church, part of the Most Holy Trinity Complex in Venosa (Italy), the investigation examines degradation phenomena across a 60 m² stone masonry area.
Diverse colour-detection techniques were initially applied to the photogrammetric point cloud and subsequently to the corresponding polygonal model. These methodologies are rigorously assessed through both analytical and visual comparisons, providing a comprehensive evaluation of their effectiveness, reliability, and accuracy in detecting decay patterns, ultimately offering innovative solutions for the preservation and monitoring of heritage assets.
1.2 Overview of the Case Study
The Most Holy Trinity Complex, located in the ancient Latin colony of Venosa within the Basilicata region of Southern Italy, is an important historical site with an architectural evolution spanning from the Roman period (3rd century BC) to the Baroque era (17th-18th century) [24]. The entire site features the ancient church, which features a Paleo-Christian design with a central nave, side aisles, and a unique corridor crypt. Adjacent to it is a guesthouse, while behind the church stands the ‘Unfinished’ church, a grand but incomplete structure (Figure 1).
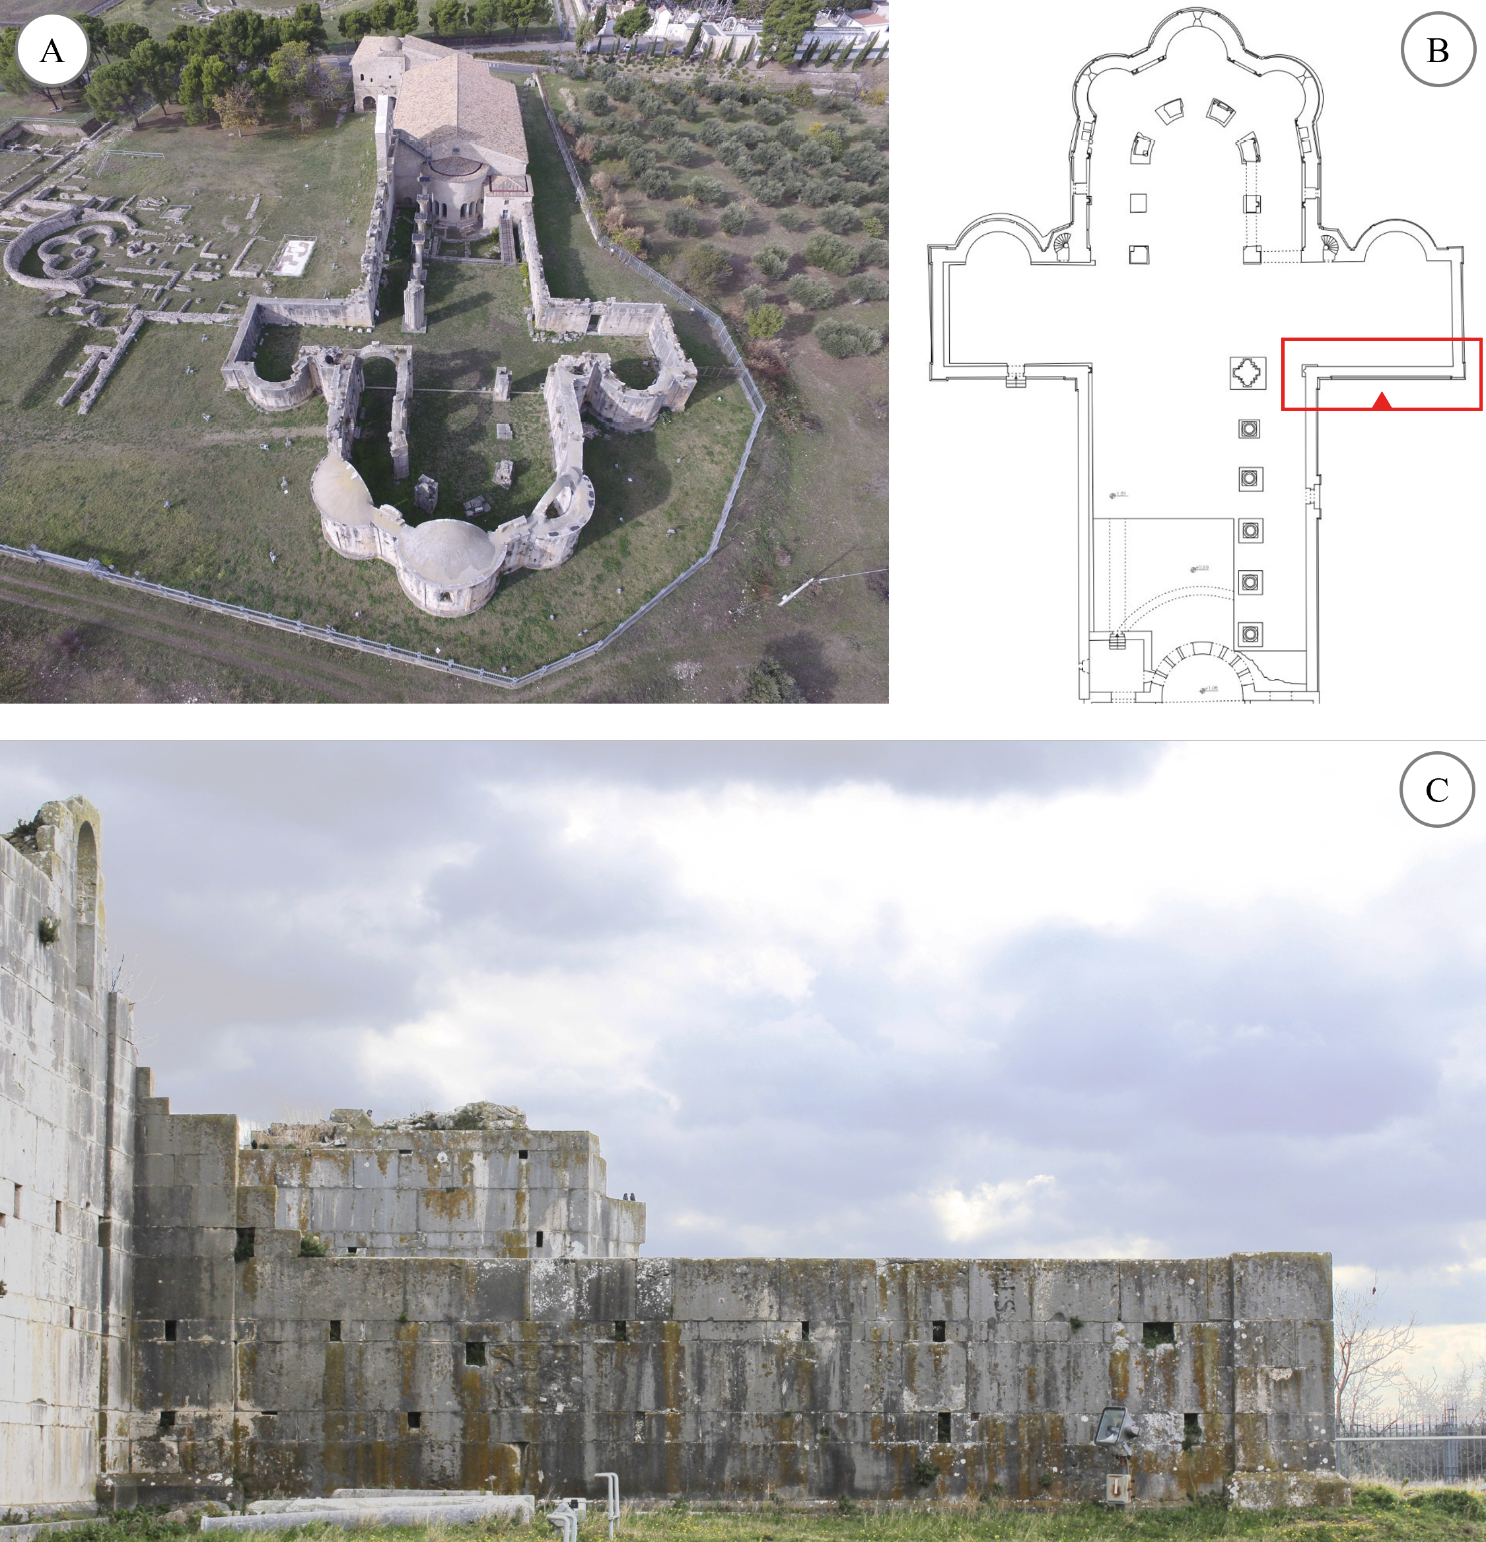
The ancient church underwent significant modifications, influenced by the Lombards in the 10th century and the Normans in the 11th and 13th centuries. In 1059, Pope Nicholas II consecrated the abbey, establishing it as a shrine for the Hauteville family at Robert Guiscard’s request. By 1297, the Order of Malta took custodianship of the complex, though the construction of the new church was never completed. Today, the complex remains an exceptional example of medieval architecture, offering a valuable insight into the construction techniques and cultural influences that shaped the region over centuries [25].
2. Methodology
The workflow, as shown in Figure 2 begins with the generation of a point cloud representing the wall face of the unfinished church, derived from high-resolution photographic images, with a particular focus on its classification using Agisoft Metashape Pro 1.5.0 software. The methodology utilises RGB data to identify and delineate regions exhibiting surface alterations accurately. These phenomena, represented as point clouds, are subsequently converted into polygonal meshes to facilitate the calculation of degradation surfaces – an analysis that would not be feasible using point clouds alone.
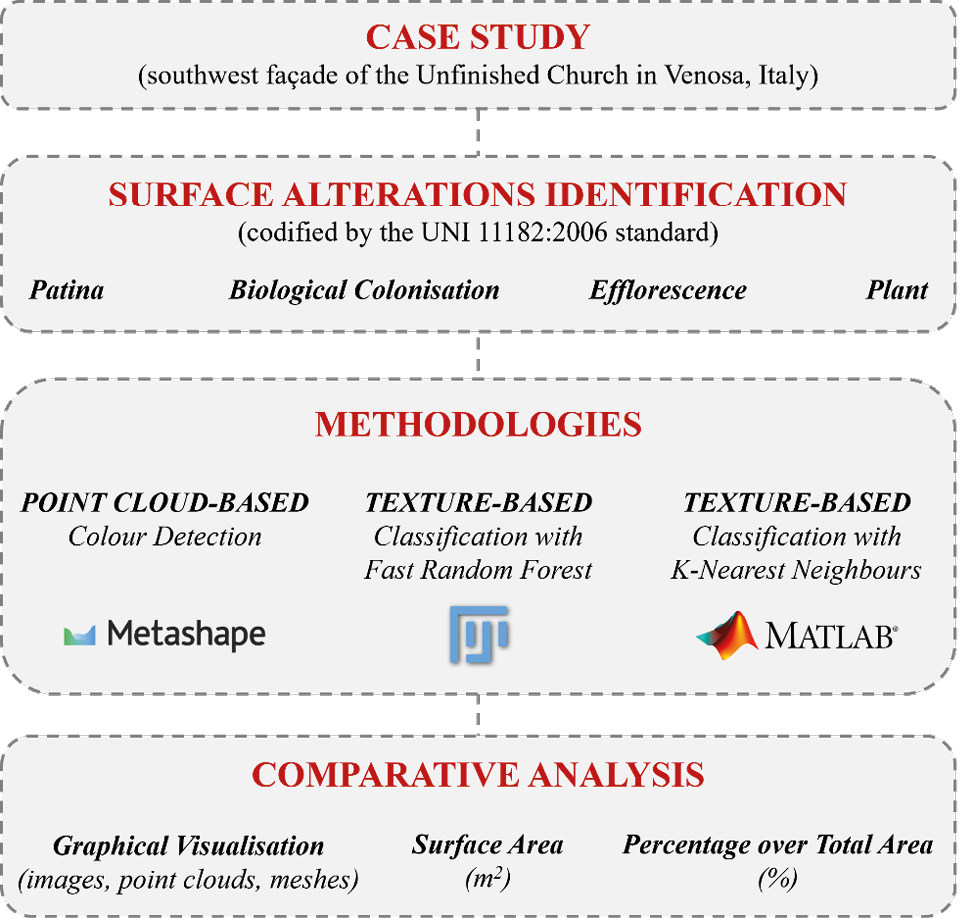
Next, automatic degradation recognition is conducted through the analysis of the UV texture, extrapolated from the polygonal mesh generated from the complete RGB point cloud. This process employs two AI algorithms: Fast Random Forest (FRF), implemented via the open-source software FIJI 1.52r, and K-NN, customised within the MATLAB environment. The three degradation analysis methods – one based on colour detection from the point cloud and two on texture analysis – are then compared to assess their effectiveness.
2.1 Building the Point Cloud and the Polygonal Model
The first step involved the construction of the 3D point cloud of the southwest façade of the Unfinished Church using photogrammetric techniques. A Canon EOS 1200D DSLR camera and a Phantom DJI 3 Professional drone captured 269 images for model reconstruction, with a maximum distance of 10 metres from the surface and an 80% overlap between adjacent shots in both directions. The images were preprocessed using Adobe Photoshop’s Camera Raw plugin to optimise exposure, contrast, saturation, sharpness, and white and black balance. The images were then imported into Agisoft Metashape Pro for digital processing and 3D spatial data generation. Initial image alignment was performed automatically by the software through the detection of tie points. In cases of misalignment, additional tie points were manually added.
To verify the alignment accuracy, both automated and manual methods were employed, generating a sparse point cloud. Once the alignment was refined, a dense point cloud of approximately 64 million points was generated, later reduced to 40 million by removing irrelevant sections. The point cloud was scaled to real-world dimensions based on on-site measurements. A textured polygonal mesh consisting of approximately 8 million faces was then created, and an 8192×8192 pixel UV map was extracted, which was subsequently downscaled to 1024×1024 pixels for surface alteration analysis.
2.2 Colour-Detection on the Point Cloud
Starting from the reconstruction of the dense point cloud, Metashape software was used to identify and extract point sets based on uniform chromatic features, aiming to create a degradation map. During the analysis, four types of surface alteration phenomena were detected, as defined by the UNI 11182:2006 standard ‘Cultural Heritage - Natural and Artificial Stone - Description of the Alteration - Terminology and Definition’ [26] and the Illustrated Glossary on Stone Deterioration Patterns [27]:
i. Patina: ‘Chromatic modification of the material, generally resulting from natural or artificial ageing and not involving in most cases visible surface deterioration’;
ii. Biological Colonisation (or Biological Patina): ‘Colonisation of the stone by plants and micro-organisms such as bacteria, cyanobacteria, algae, fungi and lichen (symbioses of the latter three). Biological colonisation also includes influences by other organisms such as animals nesting on and in stone’;
iii. Efflorescence: ‘Generally whitish, powdery or whisker-like crystals on the surface. Efflorescences are generally poorly cohesive and commonly made of soluble salt crystals’;
iv. Plant (or Vegetation): ‘Vegetal living being, having, when complete, root, stem, and leaves, though consisting sometimes only of a single leafy expansion (e.g. Tree, fern, herb)’.
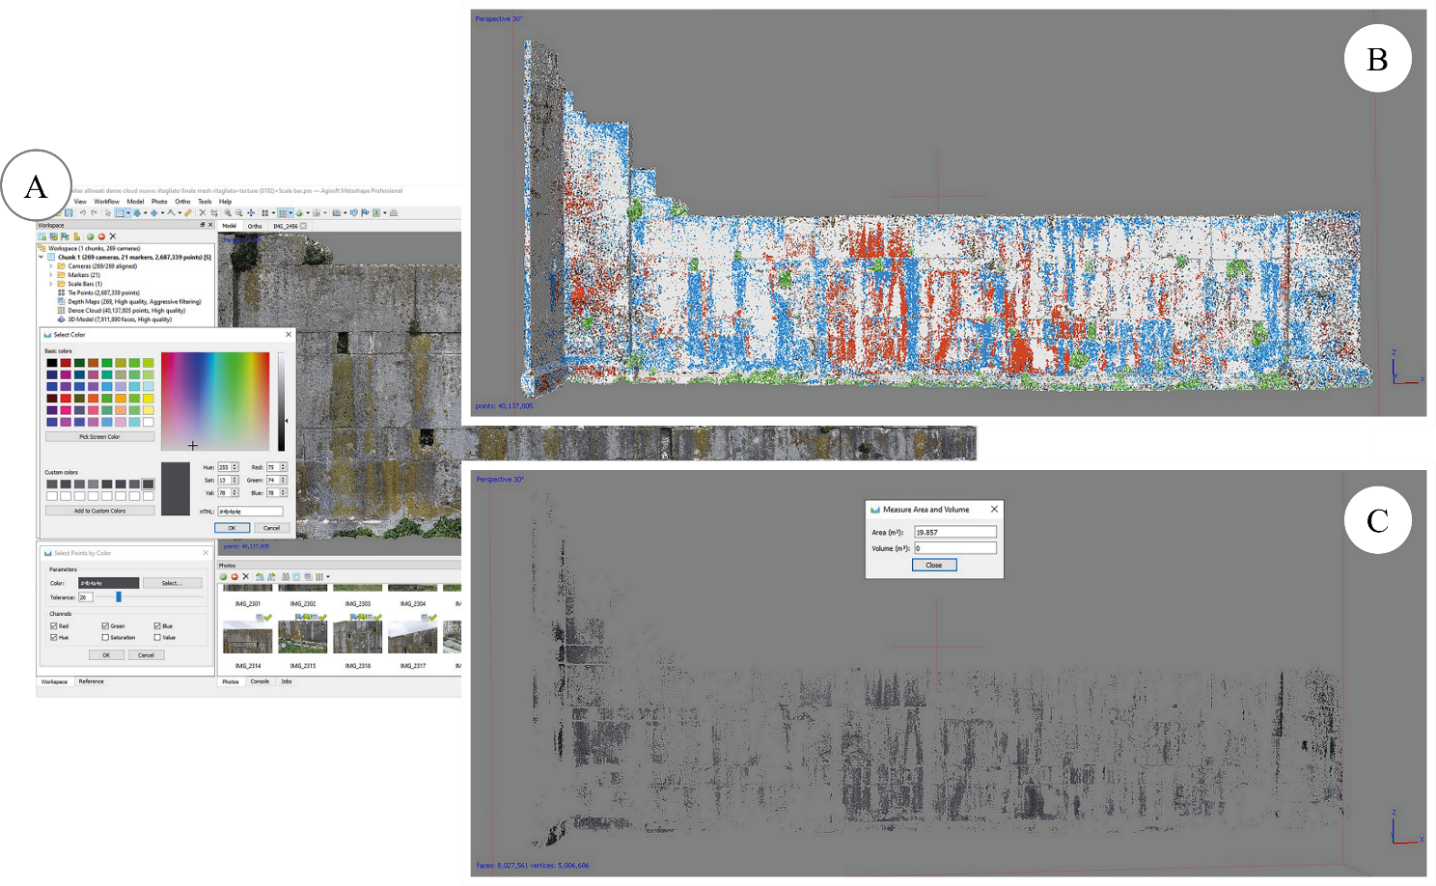
The software enabled the classification of degradation types within the point cloud by detecting representative points based on RGB values (red, green, and blue), which were used to map surface alterations. Subsequently, the algorithm was trained to segment the point cloud automatically, using conditional statements to identify points based on defined colour criteria. Specifically, the procedure for tie point selection based on colour intensities involved several key steps.
First, the script accessed the active document and chunk in Metashape, importing the necessary libraries and retrieving the point cloud and track data. Colour parameters (‘r’, ‘g’, ‘b’) and a tolerance value were defined to set the range for selecting points based on their colour. The script then iterated through the point cloud, selecting points whose colours fell within the specified range, considering the tolerance. Once the points were selected, the Metashape interface was updated to reflect the changes, completing the point identification process.
For the manual selection, ten groups of representative points were annotated for each degradation type, which facilitated the definition of a tolerance range for automated segmentation and the extraction of semantic point cloud classes. Finally, polygonal meshes were generated from these surface alteration classes. These continuous three-dimensional models, composed of networks of flat surfaces oriented in space, enabled the calculation of areas affected by various degradation patterns, while turning off mesh interpolation to prevent the artificial insertion of data into areas that are effectively voids or gaps (Figure 3).
2.3 Texture-based Classification on the Polygonal Model with Fast Random Forest Algorithm
To assess the effectiveness of various automated methods for identifying superficial alterations on stone surfaces, image processing techniques were applied to the 3D model of the church, focusing on texture features associated with degradation. A textured polygonal mesh of the façade was created using Metashape Pro software, followed by the extraction of a UV map. UV mapping transforms the 3D model, defined by points with x-y-z coordinates, into a 2D surface represented by u-v coordinates. This facilitates the arrangement of the model’s polygons on a 2D plane for analysis.
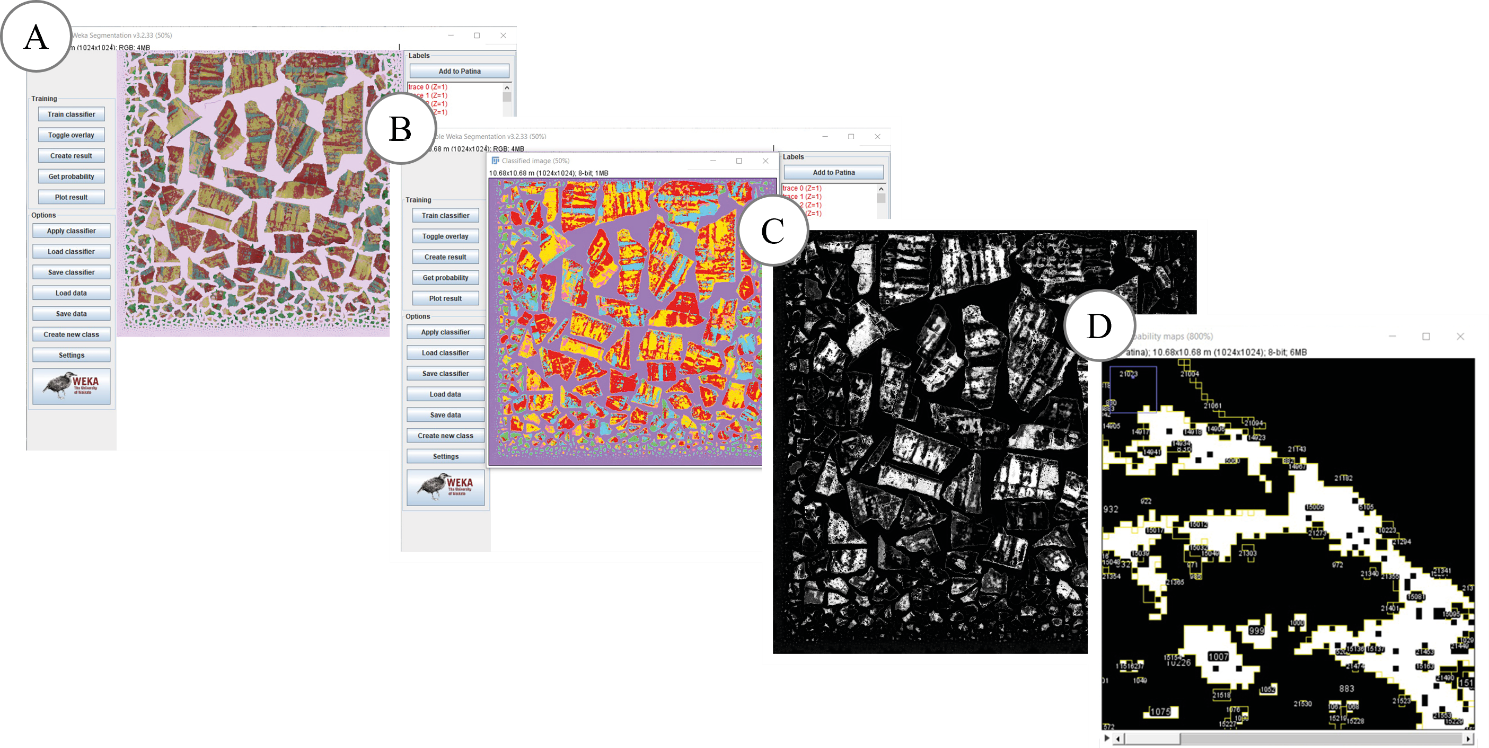
The UV map of the façade was then imported into FIJI®, an open-source image processing software based on the Java programming language. To ensure accurate classification, a reference scale was established by inputting measured distances between targets on the Metashape-processed model, correlating pixel-based measurements with the actual physical dimensions. The software automatically converted the 1024×1024 pixel RGB image into a metric scale of 10.68×10.68 metres. The FRF algorithm, a variant of the RF framework, was used for texture-based classification via the Trainable WEKA Segmentation plugin [28]. FRF optimises the traditional RF method by reducing training time while maintaining high predictive accuracy, making it computationally efficient for large datasets.
Specifically, FRF constructs an ensemble of decision trees, where each tree is built from a random subset of the training data. Key aspects of the algorithm include:
– Decision Trees: Each tree splits the data recursively based on impurity measures like Gini impurity or information gain, aiming to reduce uncertainty at each node.
– Random Feature Selection: For computational efficiency, only a random subset of features is evaluated at each split, which helps to reduce the complexity of the model without sacrificing accuracy.
– Ensemble Learning: The classification is determined by majority voting across the trees in the ensemble, improving generalisation and robustness.
– Statistical Foundation: The algorithm seeks to minimise impurity at each split, with the goal of creating nodes that are as homogeneous as possible, thereby increasing the purity of the resulting subsets.
– Final Prediction: The output class for a given input is the one that receives the most votes from all decision trees.
In this study, the classifier was configured with 200 trees and two random features per node, balancing computational efficiency and classification accuracy.
During classification, regions of interest (ROI) were manually selected for each texture type, including ‘Patina’, ‘Biological Colonisation’, ‘Efflorescence’, ‘Plant’, ‘No Pathology’, and ‘Background’. Each texture class was represented by ten training regions. The classification process yielded a 32-bit UV map, which was subsequently converted to an 8-bit image for more efficient manipulation. Probability maps, highlighting areas of degradation in red, were then generated. A black and white binary conversion process was applied to separate objects from the background, with threshold values calculated iteratively until they surpassed the mean pixel value.
The surface areas of the identified degradation features were calculated by defining pixel area ranges (in m²) and excluding irrelevant areas of the image using circularity values, which quantify the shape of the objects, where a value of 1.0 corresponds to a perfect circle, and values approaching 0.0 indicate more elongated or irregular shapes. Figure 4 shows the entire texture-based process.
2.4 Texture-based Classification on the Polygonal Model with K-Nearest Neighbours Algorithm
In addition to the FRF method, an exploratory study was conducted using the K-NN algorithm, implemented within the MATLAB environment, to classify UV textures extracted from the 3D model of the church. The K-NN algorithm works by calculating the Euclidean distance in an n-dimensional space between the target pixel and the training data points, where n corresponds to the number of attributes used in the classification. Unlike traditional nearest-neighbour methods, K-NN classifies a target based on the majority vote of the k-nearest neighbours, thus improving robustness to outliers and noise within the dataset.
The classification process (Figure 5) involved several key steps:
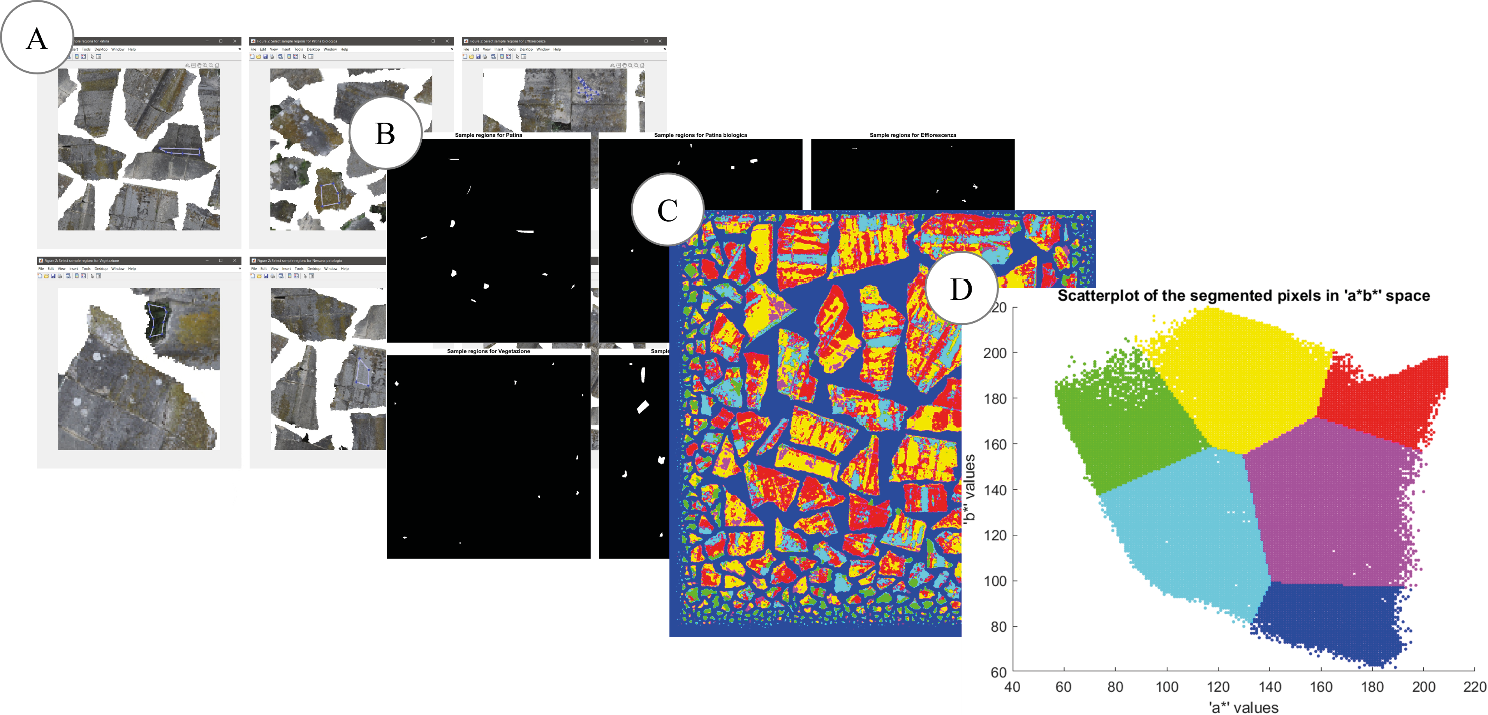
– Image Preprocessing: The source RGB image is first visualised, and its pixel dimensions, as well as its real-world size in metres, are defined. This enables a direct link between the image’s spatial resolution and actual object dimensions.
– Selection of Regions of Interest (ROIs): For each class, the user manually selects at least 10 example regions directly from the image. These regions are stored in the ‘sample_regions’ cell array, marking the positions of selected regions that represent each class. This step is essential for capturing the class features, particularly when they are difficult to model mathematically.
– Colour Space Conversion: The RGB image is converted to the L*a*b* (CIELAB) colour space. This transformation separates the chromatic components (‘a*’ and ‘b*’) from the brightness (‘L*’) component, thus improving the algorithm’s ability to capture colour variations while reducing the influence of lighting conditions.
– Classification Using K-NN: For each pixel, the Euclidean distance to the mean values of each class in the ‘a*’ and ‘b*’ colour channels is computed. The pixel is then assigned to the class of its k-nearest neighbours, with k=3. This choice of k balances local sensitivity (k=1) and robustness to noise (k>1), making it ideal for accurately classifying the image’s local features.
– Visualisation of the Classified Image: Once classified, a colour-coded image is generated, with each class represented by a specific colour. This coloured representation provides a clear visual interpretation of the classified results.
– Scatter Plot in the ‘ab’ Colour Space: A scatter plot is created to visualise the distribution of classified pixels in the ‘a*’ and ‘b*’ colour channels. This plot reveals the separability of the classes and aids in identifying any overlaps or clear distinctions in the data.
– Calculation and Visualisation of Percentage Areas: The number of pixels and the corresponding area (in square metres) for each class are calculated. These values are then converted into percentage areas relative to the total surface area, providing a quantitative measure of the spatial distribution of the various degradation types.
3. Results
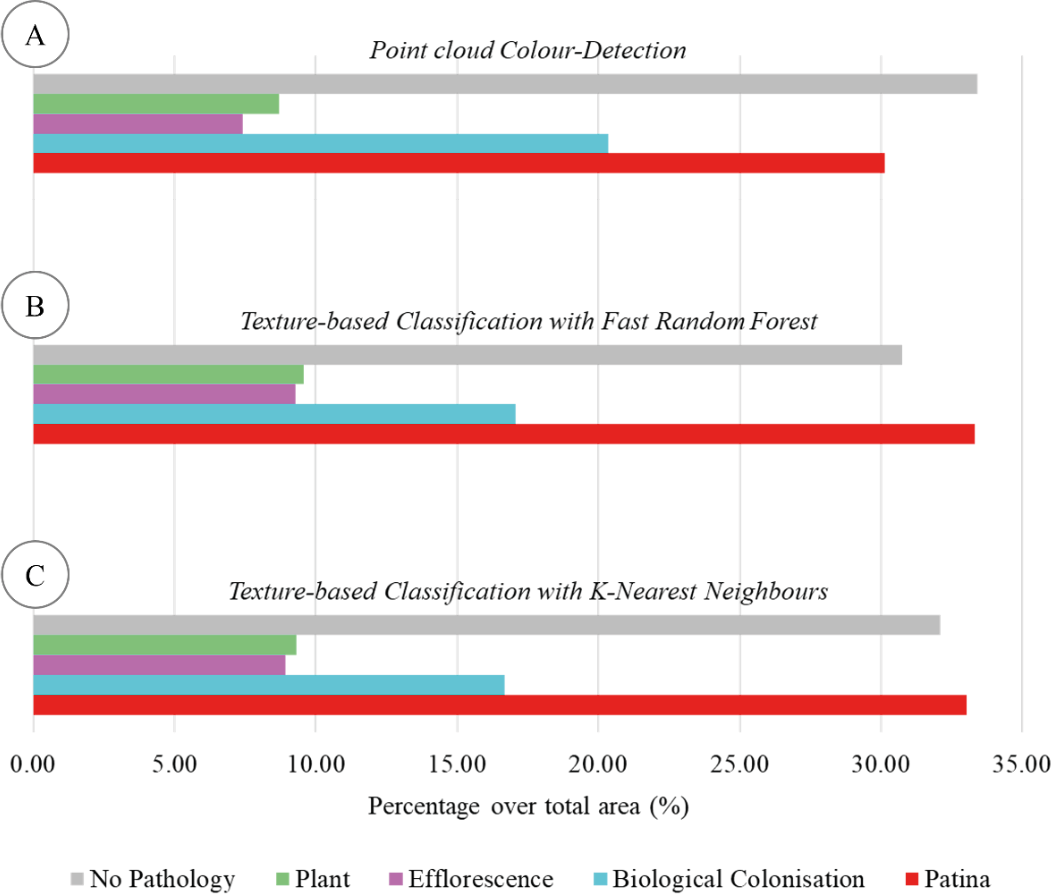
The outcomes of the degradation mapping are presented through graphical representations, surface area measurements, and percentage values relative to the total examined area. A comparative analysis is conducted across three proposed classification methodologies: Point Cloud (PC) Colour-based, Texture-Based with FRF, and Texture-Based with K-NN. The results include both the classified point cloud and the polygonal meshes onto which the UV textures classified by the two texture-based methods were reprojected (Figure 6 and Figure 7). To enhance the clarity and consistency of visual interpretation, uniform colours were assigned to each class across all methodologies: ‘Patina’ (pure red), ‘Biological Colonisation’ (cyan), ‘Efflorescence’ (magenta), ‘Plant’ (pure green), and ‘No Pathology’ (pure grey).
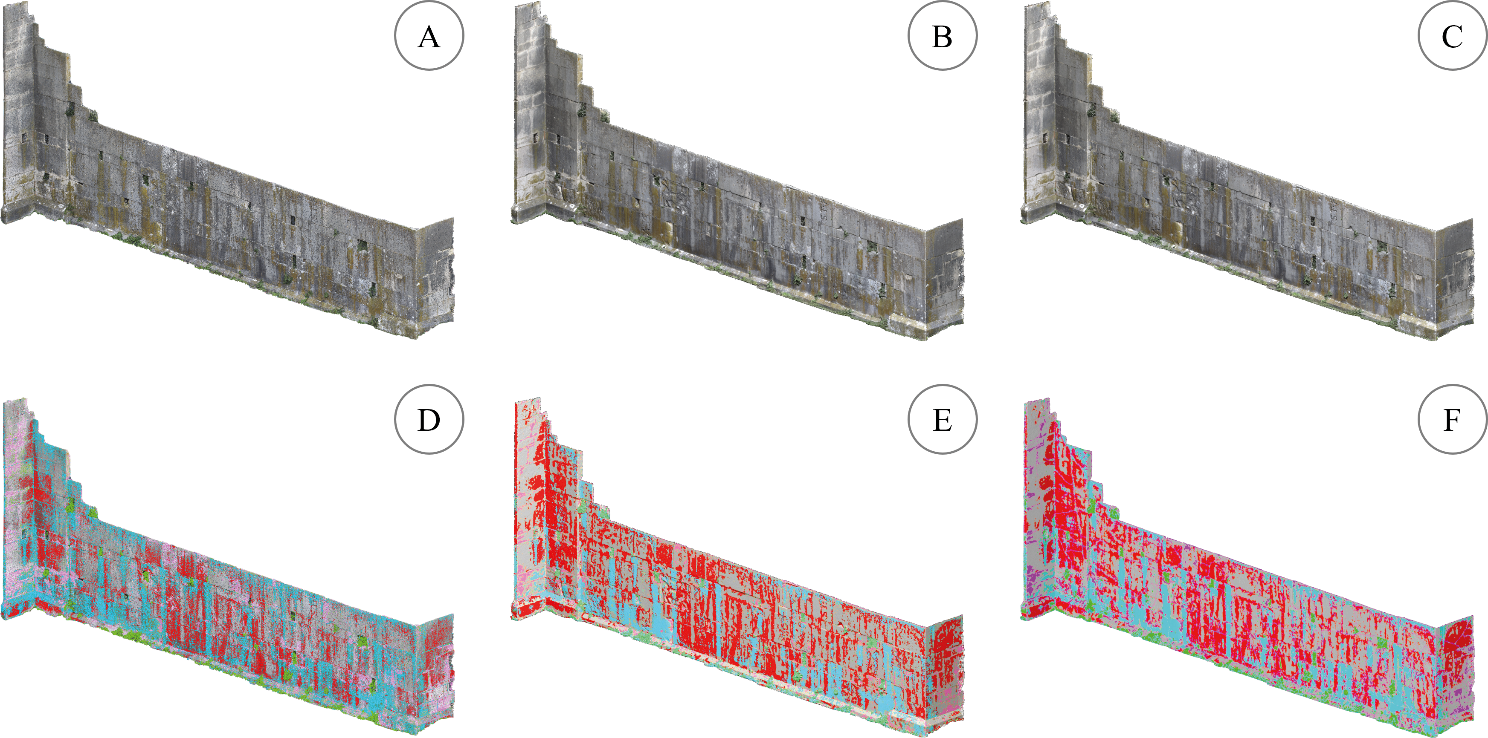
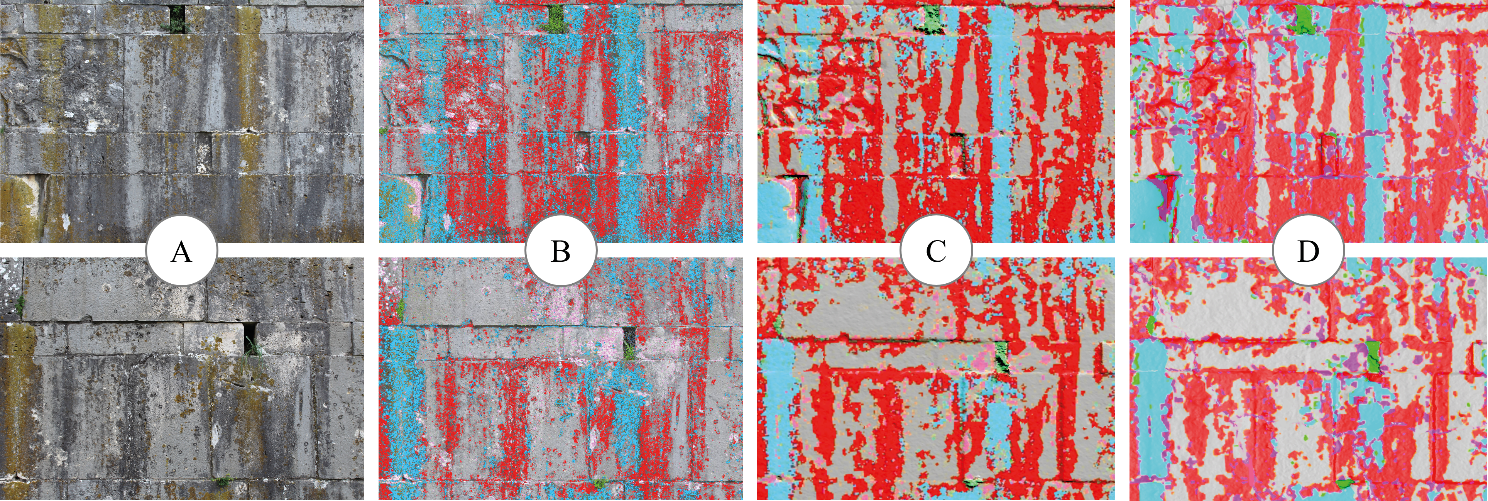
From a visual quality perspective, significant progress has been achieved in identifying patterns corresponding to different degradation phenomena, leveraging classifications derived from the dense point cloud. However, it is important to acknowledge that classification, while robust, is not entirely unequivocal. Lower accuracy or a reduced dataset can introduce errors, leading to the representation of a segmented region under multiple labelled classes. The texture-based approach, implemented using both FRF and K-NN, aligns visually with the point cloud colour-based method but encounters specific challenges, particularly in accurately identifying the Efflorescence phenomenon. A slight misclassification is observed due to potential confusion with plant-origin substances secreted by lichens within the Biological Colonisation category. However, the Patina and Plant phenomena are more precisely recognised, especially when employing the FRF method.
A quantitative evaluation of the three mapping approaches reveals significant variations in the estimated areas of degradation categories (Table 1).
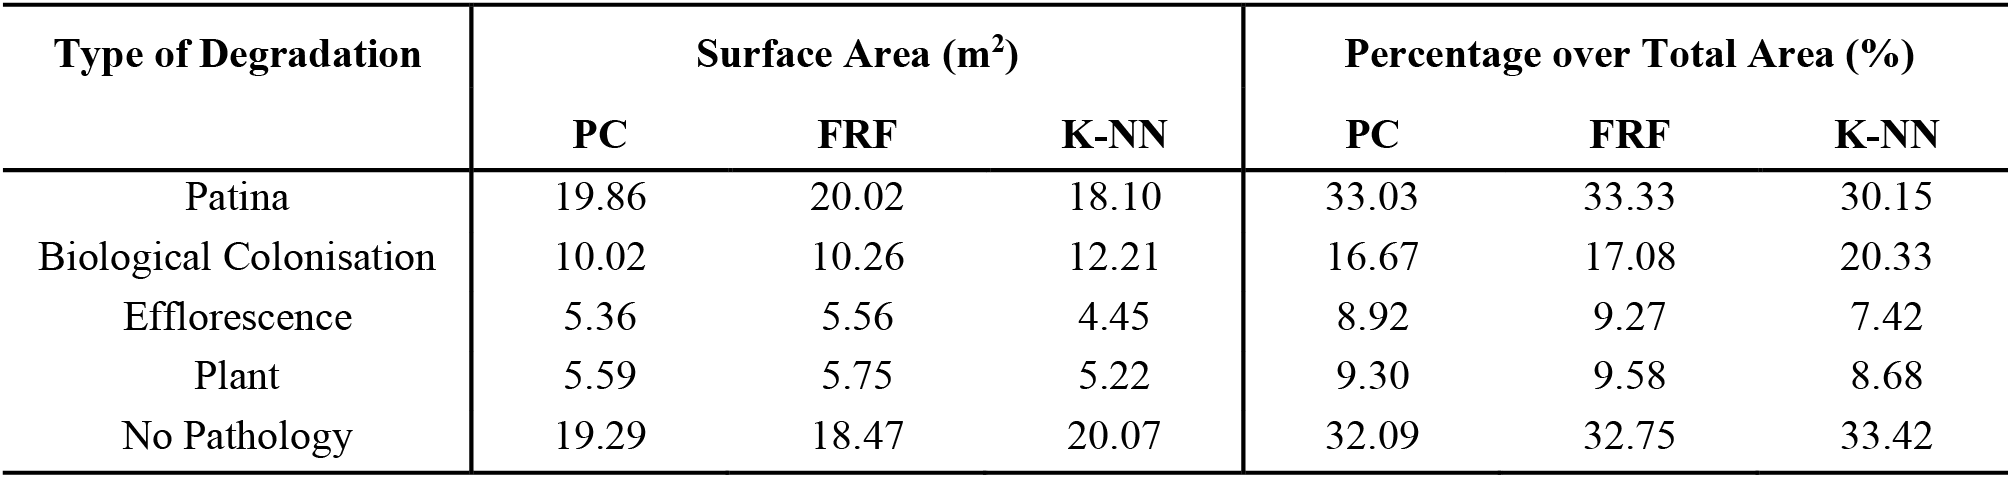
In the point cloud colour-based method, ‘Patina’ emerges as the most prominent category, covering 33.03% of the total surface, closely followed by ‘No Pathology’ at 32.09%. Other categories exhibit a balanced distribution, with ‘Biological Colonisation’ and ‘Efflorescence’ accounting for 16.67% and 8.92%, respectively, while ‘plant’ covers 9.30% of the area. The FRF Texture-based approach maintains ‘Patina’ as the dominant category at 33.33% but introduces a notable redistribution of the remaining categories. ‘Biological Colonisation’ increases slightly to 17.08%, while ‘Efflorescence’ and ‘Plant’ show increments to 9.27% and 9.58%, respectively. ‘No Pathology’ experiences a minor decline to 32.75%. The K-NN Texture-based approach exhibits substantial variations, with ‘Biological Colonisation’ emerging as the dominant category at 20.33%, surpassing ‘Patina’ (30.15%). ‘Efflorescence’ significantly decreases to 7.42%, while ‘Plant’ and ‘No Pathology’ maintain stable proportions at 8.68% and 33.42%, respectively.
A comparative analysis (Figure 8) highlights that the point cloud colour-based approach results in a relatively balanced distribution among degradation categories, with ‘Patina’ and ‘No pathology’ in near equilibrium. The FRF approach indicates an increased estimation of ‘Plant’ and a redistribution of other categories compared to the colour-based method. In contrast, the K-NN approach exhibits a significant shift, with ‘Biological Colonisation’ taking precedence and notable fluctuations in other surface estimations.
4. Limitations of the Research
This study has demonstrated the potential of integrating AI into Built Heritage, particularly through semi-automated processes for extracting chromatic properties from point clouds and photorealistic 3D models. However, several limitations must be acknowledged.
One of the key limitations was the lack of a universally accepted objective criterion for classification assessment, as no absolute ground truth was used in the comparative analysis. Furthermore, point cloud classification, while providing valuable insights, often requires case-by-case evaluation during the interpolation of polygonal meshes to ensure accurate surface calculation and prevent errors such as missing areas or distortions in the final output.
The methodologies employed also exhibit varying levels of accessibility. Open-source tools like FIJI perform exceptionally well despite being free, offering a high degree of functionality and flexibility for many applications, especially when compared to proprietary software like Metashape, which, although more expensive, tends to be more limiting in this case. Moreover, using dedicated programming languages allows for high customisation, but this requires advanced technical expertise and a significant initial investment in algorithm development.
Another important consideration is the inherent variability of the data during the training process, as human supervision remains essential, particularly in the initial stages of data selection and annotation, to ensure that the colour and textural characteristics employed are accurate and meaningful.
5. Conclusions and Future Developments
The integration of semi-automated processes for extracting chromatic properties from point clouds and 3D models represents a significant advancement in automation and efficiency. Nonetheless, while this study has primarily focused on the final classification outcomes, future research will emphasise the adoption of standardised and robust criteria to ensure a more objective and precise assessment of model performance.
Moving forward, further advancements are anticipated in the integration of semantic data within Scan-to-BIM modelling platforms. Point clouds capturing the spatial extent of degradation or textures representing surface conditions will be effectively incorporated into BIM models. These semantic data layers will be mapped to specific building elements, such as walls, providing a more precise and contextualised representation of deterioration.
By associating these degradation markers with relevant material properties, historical data, and construction techniques within IFC-compatible digital formats, BIM will facilitate more informed decision-making for conservation and restoration efforts while ensuring seamless interoperability with advanced analytical tools. This integration will further strengthen heritage monitoring and conservation, enhancing the ability to preserve historic buildings more effectively.
Moreover, future research will greatly benefit from the integration of cutting-edge technologies, including SAM, Generative Adversarial Networks (GANs), and advanced DL frameworks. These innovations are expected to enhance both the accuracy and automation of degradation diagnostics, ultimately enabling more data-driven and efficient heritage preservation strategies.
6. Authors Contributions
Michele Buldo: Conceptualisation, Methodology, Software, Validation, Formal Analysis, Investigation, Resources, Data Curation, Writing – original draft preparation, Writing – review and editing, Visualisation, Project Administration, Funding Acquisition. Fabio Fatiguso: Conceptualisation, Methodology, Investigation, Resources, Writing – review and editing, Visualisation, Supervision, Project Administration, Funding Acquisition. Elena Cabrera-Revuelta: Conceptualisation, Methodology, Investigation, Resources, Writing – review and editing, Visualisation, Supervision, Project Administration, Funding Acquisition. Cesare Verdoscia: Conceptualisation, Methodology, Investigation, Resources, Writing – review and editing, Visualisation, Supervision, Project Administration, Funding Acquisition.
7. Funding
This research, carried out as part of the corresponding author’s PhD project, was conducted in collaboration between the Politecnico di Bari and the Universidad de Cádiz. The work was supported by the European Union under the ‘POR Puglia FESR-FSE 2014/2020’ programme (doctoral scholarship co-funding) and by the National Recovery and Resilience Plan (NRRP) research project ‘ReACT – (planning) Resilient urban and metropolitAn built environments through inClusive mulTi-risk behavioural-based models and simulations’ (Scientific Coordinator: Prof. Fabio Fatiguso), which provided additional funding for publication.
8. References
[1] Vecco M (2010) A definition of cultural heritage: From the tangible to the intangible. J Cult Herit 11:321–324. https://doi.org/10.1016/j.culher.2010.01.006
[2] Gulotta D, Toniolo L (2019) Conservation of the Built Heritage: Pilot Site Approach to Design a Sustainable Process. Heritage 2:797–812. https://doi.org/10.3390/heritage2010052
[3] Biasi A, Riavis V, Zamboni I, Cervesato A (2024) Urban Architectural Heritage and Climate Change. An opportunity to address its complexity. Agathon Int J Archit Art Des 16:130–143. https://doi.org/10.19229/2464-9309/16112024
[4] Nastou MPP, Zerefos SC (2024) Effects of climate change on open air heritage: a review and the situation in the region of Mediterranean. Herit Sci 12:1–25. https://doi.org/10.1186/s40494-024-01484-y
[5] Russo M, Manferdini AM (2014) Integration of image and range-based techniques for surveying complex architectures. ISPRS Ann Photogramm Remote Sens Spatial Inf Sci 2:305–312. https://doi.org/10.5194/isprsannals-II-5-305-2014
[6] Mendoza MAD, De La Hoz Franco E, Gómez JEG (2023) Technologies for the Preservation of Cultural Heritage—A Systematic Review of the Literature. Sustainability 15:1–28. https://doi.org/10.3390/su15021059
[7] Silva C, Oliveira L (2024) Artificial Intelligence at the Interface between Cultural Heritage and Photography: A Systematic Literature Review. Heritage 7:3799–3820. https://doi.org/10.3390/heritage7070180
[8] Zhao J, Hua X, Yang J, Yin L, Liu Z, Wang X (2023) A review of point cloud segmentation of architectural cultural heritage. ISPRS Ann Photogramm Remote Sens Spatial Inf Sci X-1/W1-2023:247–254. https://doi.org/10.5194/isprs-annals-X-1-W1-2023-247-2023
[9] Zhang R, Wu Y, Jin W, Meng X (2023) Deep-Learning-Based Point Cloud Semantic Segmentation: A Survey. Electronics 12:1–25. https://doi.org/10.3390/electronics12173642
[10] Mishra M, Zhang K, Mea C, Barazzetti L, Fassi F, Fiorillo F, Previtali M (2024) Deep Learning-Based AI-Assisted Visual Inspection Systems for Historic Buildings and their Comparative Performance with ChatGPT-4O. Int Arch Photogramm Remote Sens Spatial Inf Sci XLVIII-2/W8-2024:327–334. https://doi.org/10.5194/isprs-archives-XLVIII-2-W8-2024-327-2024
[11] Lee SY, Cho HH (2023) Damage Detection and Safety Diagnosis for Immovable Cultural Assets Using Deep Learning Framework. In: International Conference on Advanced Communication Technology (ICACT). Global IT Research Institute (GiRI), pp 310–313. https://doi.org/10.23919/ICACT56868.2023.10079559
[12] Meroño JE, Perea AJ, Aguilera MJ, Laguna AM (2015) Recognition of materials and damage on historical buildings using digital image classification. S Afr J Sci 111:1–9. https://doi.org/10.17159/sajs.2015/20140001
[13] Kwon D, Yu J (2019) Automatic Damage Detection of Stone Cultural Property based on Deep Learning Algorithm. Int Arch Photogramm Remote Sens Spatial Inf Sci - ISPRS Arch 42:639–643. https://doi.org/10.5194/isprs-archives-XLII-2-W15-639-2019
[14] Grilli E, Remondino F (2019) Classification of 3D digital heritage. Remote Sens 11:1–23. https://doi.org/10.3390/RS11070847
[15] Fatiguso F, Buldo M (2020) Complesso della SS. Trinità di Venosa (PZ). In: De Fino M, Fatiguso F (eds) La diagnostica per gli edifici storici: Metodi non distruttivi e tecnologie innovative per la valutazione e il controllo. Collana Architettura sostenibile/culture costruttive per il recupero sostenibile. EdicomEdizioni, Monfalcone, Italy, pp 169–180
[16] Latifi R, Hadzima-Nyarko M, Radu D, Rouhi R (2023) A Brief Overview on Crack Patterns, Repair and Strengthening of Historical Masonry Structures. Materials 16:1–22. https://doi.org/10.3390/ma16051882
[17] Valero E, Forster A, Bosché F, Hyslop E, Wilson L, Turmel A (2019) Automated defect detection and classification in ashlar masonry walls using machine learning. Automation in Construction 106:102846. https://doi.org/10.1016/j.autcon.2019.102846
[18] Buldo M, Agustín-Hernández L, Verdoscia C (2024) Semantic Enrichment of Architectural Heritage Point Clouds Using Artificial Intelligence: The Palacio de Sástago in Zaragoza, Spain. Heritage 7:6938–6965. https://doi.org/10.3390/heritage7120321
[19] Matrone F, Felicetti A, Paolanti M, Pierdicca R (2023) Explaining AI: Understanding Deep Learning Models for Heritage Point Clouds. ISPRS Ann Photogramm Remote Sens Spatial Inf Sci 10:207–214. https://doi.org/10.5194/isprs-annals-XM-1-2023-207-2023
[20] Buldo M, Agustín-Hernández L, Verdoscia C, Tavolare R (2023) A Scan-to-BIM workflow proposal for Cultural Heritage. Automatic point cloud segmentation and parametric-adaptive modelling of vaulted systems. Int Arch Photogramm Remote Sens Spat Inf Sci - ISPRS Arch 48:333–340. https://doi.org/10.5194/isprs-archives-XLVIII-M-2-2023-333-2023
[21] Aricò M, Ferro C, La Guardia M, Lo Brutto M, Taranto G, Ventimiglia GM (2024) Scan-to-BIM Process and Architectural Conservation: Towards an Effective Tool for the Thematic Mapping of Decay and Alteration Phenomena. Heritage 7(11):6257–6281. https://doi.org/10.3390/heritage7110294
[22] Tiribelli S, Pansoni S, Frontoni E, Giovanola B (2024) Ethics of Artificial Intelligence for Cultural Heritage: Opportunities and Challenges. IEEE Trans Technol Soc 5:293–305. https://doi.org/10.1109/TTS.2024.3432407
[23] Ge C (2024) The review of AI and cultural heritage protection—Taking the whole process of cultural heritage protection as an example. Appl Comput Eng. https://doi.org/10.54254/2755-2721/71/20241666
[24] de Lachenal L (1998) L’Incompiuta di Venosa. Un’abbaziale fra propaganda e reimpiego. Mélanges Ec Fr Rome Moyen-Age Temps Mod 110:299–315. https://doi.org/10.3406/mefr.1998.3628
[25] Laviano R, Summa V (1999) Incompiuta di Venosa (Potenza): caratteri mineralogici, petrografici e chimici dei materiali utilizzati e loro provenienza. Mineral Petrogr Acta 42:211–222
[26] Ente Italiano di Normazione (UNI) (2006) UNI 11182:2006 Cultural Heritage - Natural and Artificial Stone - Description of the Alteration - Terminology and Definition. UNI, Milano
[27] International Scientific Committee for Stone (ICOMOS) (2008) Illustrated Glossary on Stone Deterioration Patterns: Monuments and Sites. ICOMOS-ISCS, Paris
[28] Arganda-Carreras I, Kaynig V, Rueden C, Eliceiri KW, Schindelin J, Cardona A, Sebastian Seung H (2017) Trainable Weka Segmentation: a machine learning tool for microscopy pixel classification. Bioinformatics 33(15):2424–2426. https://doi.org/10.1093/bioinformatics/btx180