Analysis of Residential Buildings: Design and Implementation of a Database
Department of Architecture, University of Bologna, Italy
Email: lorenzo.stefanini2@unibo.it; giorgia.predari@unibo.it
*Corresponding author
Abstract. Preliminary investigations and analyses for building assets’ renovation require considerable time and resources. Being able to assess, in advance and on a large scale, how to address these assets would allow reducing issues to existing buildings as a priority. This research project aims to demonstrate how a data-driven approach can help make informed decisions and better allocate available resources. Starting with a sample of 468 buildings constructed in the city of Bologna between 1945 and 1965, the study led to the creation of a comprehensive database consisting of 468 records and 211 fields, grouped into 16 macro-categories. These fields represent the catalogued characteristics for each building; 95 of them were directly surveyed, and 116 were derived from the processing performed on the first 95 attributes. Each building is associated with various types of information to provide an overall framework (e.g., technical, typological, morphological, etc.). At the end of the database development, queries were performed to assess both the construction characteristics of the building sample and the qualitative performance in terms of structural, energy, and planimetric distribution. The results provide an indication of the building and show how in-depth analyses can serve as the foundation for a decision support system (DSS).
Keywords: Database, Data-driven approach, Residential building, Building performance.
1. Introduction
At the end of World War II, Italian politics recognized that the construction sector was the key to the country’s economic recovery. The famous slogan of the Democrazia Cristiana (Christian Democrat Party), “not all proletarians, but all owners” [1], sums up the concept and the urgency to provide every family or citizen with a home. In this particular context, a large number of residential buildings were built, as many as 50 per cent of the total current housing stock dates back to the period 1946-1979, according to ISTAT data [2]. These buildings were often designed and constructed in a short time, with inexpensive materials and basic techniques [3], in order to respond quickly to the needs related to reconstruction and the new demographic trend [4]. However, the poor quality of materials and the absence of strict regulations led, over time, to numerous critical issues in terms of structural safety [5-6], energy efficiency [7-8], and organization-distribution of living spaces [9]. Although the problems that similar buildings have are known, systematizing this knowledge on a large scale without homogeneous methods of investigation or evaluation is complex, as already pointed out by other works done in the field [10-11]. For this reason, creating an ordered repository is essential for decision-makers, as it can be further developed into a decision support system (DSS) that can facilitate informed policy-making. Analytical approaches based on extensive information collection have recently been explored with various objectives and in different fields. Interesting work in this area is developed by G. Uva et al. [12], who use the CARTIS [13] scheme to collect information for assessing the performance of existing buildings. More traditional data collection systems have lately been joined by procedures based on the generation of point clouds obtained with LiDAR [14] or laser scanner [15] technologies. However, the proposed solutions often concentrate on the development of a ready-to-use system for solving a specific problem; rarely is the focus shifted to the potential offered by a structured database and the importance of an organic process.
Based on this, a prototype of a queryable archive consisting of a finite set of buildings was developed with the possibility of being implemented in a decision-making platform. By consulting the archives of the Emilia Romagna Region (RER), access was gained to the original documentation (plans, sections, elevations, reports, etc.) for 468 residential buildings constructed in the city of Bologna in the two decades following World War II (1945-1965). The sample of buildings, financed either fully or partially through public funds, was analyzed from various perspectives. Based on the documentation obtained, a database was created, and each building is linked to specific information representing its key characteristics.
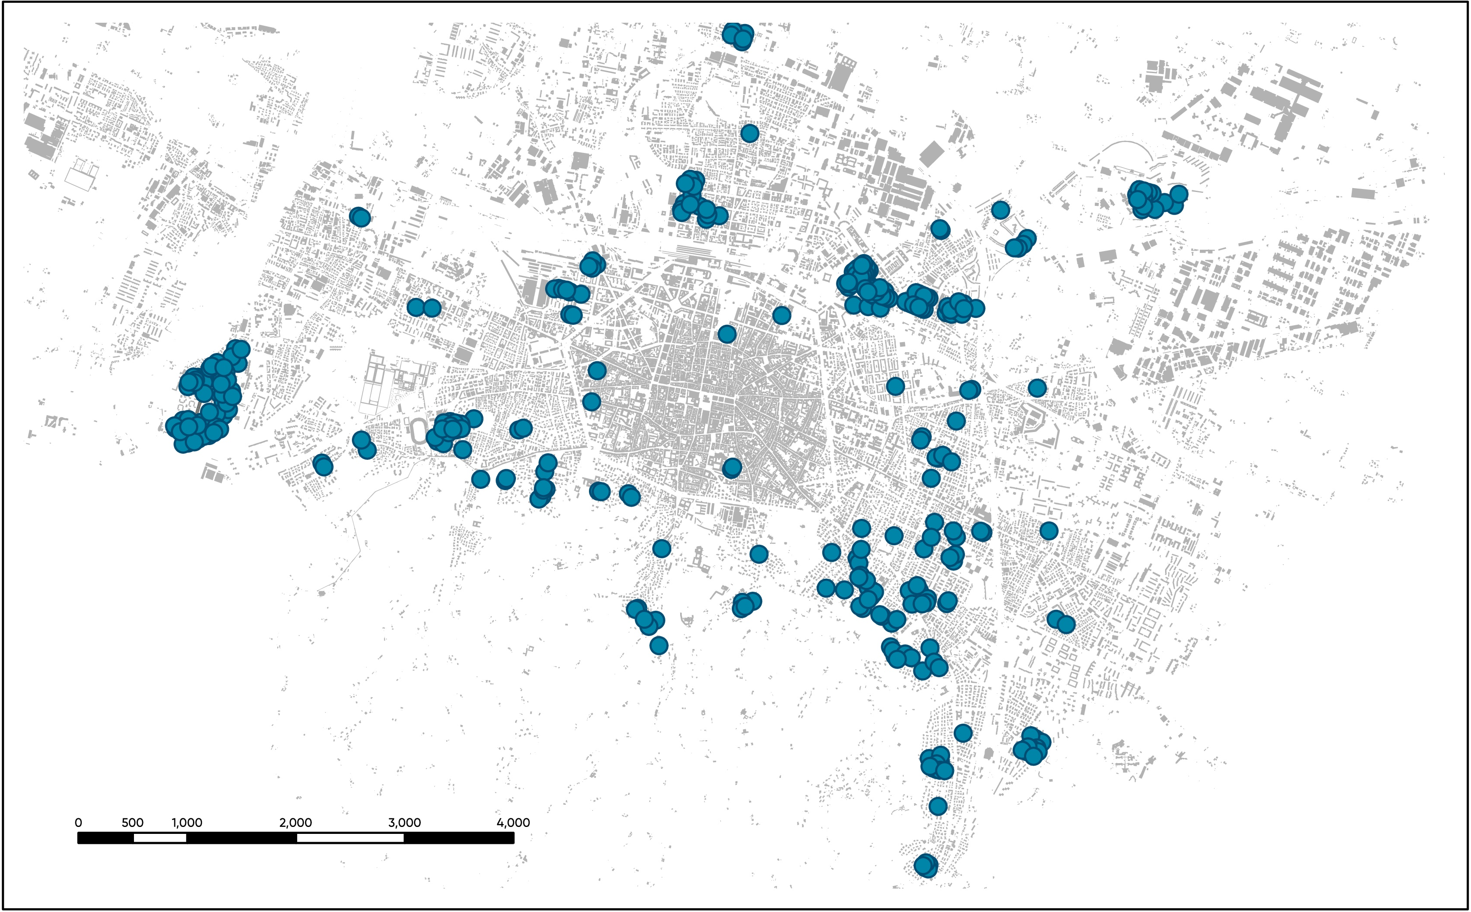
The designed database consists of 468 individual records (one for each building) and 211 unique fields (one for each catalogued attribute). The fields are organized into 16 macro-categories, which begin with the most general information and proceed progressively toward a qualitative assessment of the building condition in terms of structural integrity, energy efficiency, and spatial and organizational layout. Data integration was also carried out in parallel within a geographic information system (GIS), linking the data to the spatial locations of the respective buildings within the city of Bologna. The data entry process into the database was initially carried out manually, covering the first 95 fields. In the second phase, the information was processed and automated, with the aid of geographic and geometric parameters obtained through the GIS system, leading to the definition of the remaining 116 fields. Figure 1 shows the location of buildings in the city of Bologna.
Once the database was fully defined, queries were performed to assess both the general and specific characteristics of the analyzed sample. The results offer insights into the key characteristics of the housing stock under investigation and identify the main critical issues that emerged. Additionally, they show the potential of a data-driven approach and its compatibility with a DSS.
2. Criteria and database organization
2.1 Sources and data collection
The aim of the database is to provide comprehensive insights into the building sample through targeted queries, addressing both general aspects (such as year of construction, contractor, etc.) and qualitative assessments of building performance (e.g., structural integrity, energy efficiency, criticality, etc.). As a result, the information associated with each record is extensive (211 fields) and covers diverse aspects, acquired either as numerical values or textual descriptions.
The need to gather a significant amount of data, given that physical surveys of the buildings were not feasible, directed the research toward the documents kept in the RER archive. This archive contains numerous files of buildings constructed in the immediate postwar period with public funding. In addition to floor plans, these files are equipped with comprehensive construction documentation, which would otherwise be unavailable (such as metric calculations, special contract specifications, etc.). These drawings, produced by the original designers, provide detailed technical specifications of the buildings, ranging from layout choices to structural details like beam reinforcement.
Information not directly obtainable through archival surveys was supplemented with assumptions based on field regulations at the time, particularly in the areas of sanitation [16], structural design [17-19], and social housing [20], as well as from the most widely used design handbooks [21-22]. This parallel research not only provided additional parameters functional for data collection but also led to the creation of specific categories within the database (such as those related to structural safety). The data collection approach enabled: (1) the extraction of information directly from primary sources, without subsequent processing, (2) an expansion of the knowledge base using alternative sources beyond the archives, (3) the development of a coherent overview of the most recurrent modes of construction in the period studied, and (4) the acquisition of a vast amount of information in a short time frame and in a cost-effective manner. On the other hand, the approach considered does not allow for the achievement of the accuracy of data that would be obtained with field surveys. However, this issue is to be considered tolerable given that the analysis performed is intended as a “preliminary” phase, useful to understand the most significant aspects of the heritage under investigation and to direct (limited) economic resources to the most critical areas of the built environment. Detailed analyses can then be focused on specific buildings, making the whole process more economical and flexible. The variety of sources used required the standardization of the collected data to ensure comparability and ease of reference [23]. To ensure clarity and consistency, some input parameters were labelled with appropriate abbreviations (e.g., “structures made of unreinforced brick masonry with a thickness of 28 cm” are abbreviated as “MP-28”). Variable units (kN, daN, or kg) were converted to standard units. A data dictionary was developed and updated as the database was compiled, including metadata related to the cataloguing process. The use of consistent terminology and comparable units not only facilitated the query process, but also allowed the addition of a further 116 fields to the original data using the methods summarized below.
The database was defined by some basic criteria (No. 4) to make it consistent with the type of work to be performed. (1) Autonomous records: each record, i.e., table row, was left autonomous and not dependent on other records in the table. Each record corresponds to a building. (2) Unique records: each record is unique; repetitions within the database are excluded. (3) Unique fields: each field, i.e., table column, represents an attribute assigned to the investigated building. Fields can be stand-alone (e.g., building address) or non-stand-alone (in the case of building characteristics and vulnerability assessment). In both cases, the information appears in the database only once, which makes the file smaller and avoids complications in the query phase. (4) Both records and fields have unique names and contain a single type of data. For example, a column whose data is expected in numeric form does not contain textual information, and vice versa. The database configuration that ensures compliance with these criteria (No. 4) was performed in advance to avoid such issues during the population phase. Any errors in data input were verified at the end by manually filtering the entered information. These operations could be further automated in future developments of the method.
2.2 Database structure
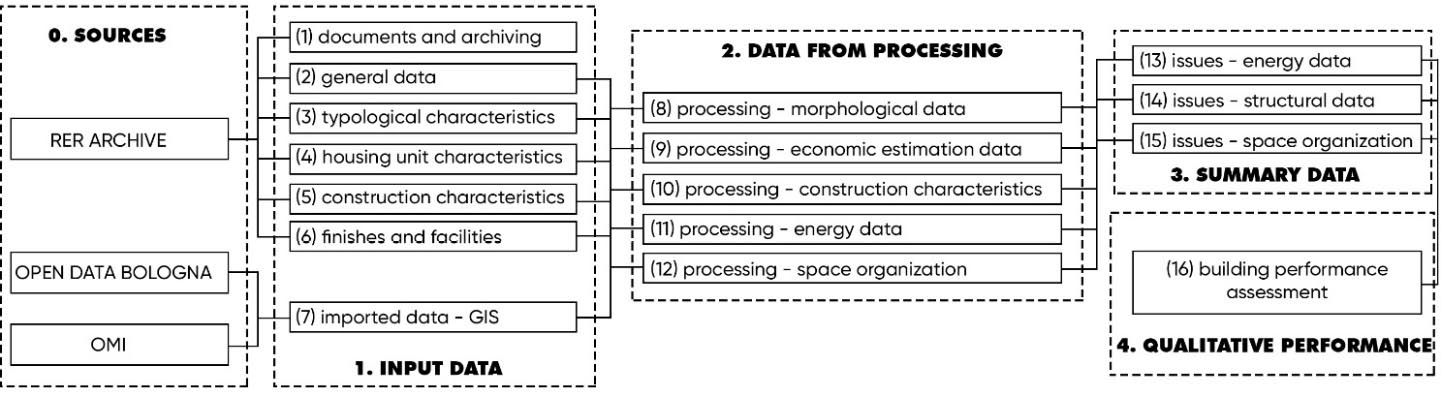
The database was implemented using Microsoft Excel software. To rationally sort the fields used, 16 macro-categories were introduced, collecting them by themes: (1) documents and archiving, (2) general data, (3) typological characteristics, (4) housing unit characteristics, (5) construction characteristics, (6) finishes and facilities, (7) imported data - GIS, (8) processing - morphological data (9) processing - economic estimation data, (10) processing - construction characteristics, (11) processing - energy data, (12) processing - space organization and functionality, (13) issues - energy data, (14) issues - structural data, (15) issues - space organization and functionality, (16) building performance assessment - current situation.
The first six macro-categories (1-6) contain the information obtained directly from the analysis of archival material and sources; there is a total of 95 fields that describe the building in its basic parts. Among the data entered are: the address of the building, key cadastral references, names of stakeholders in the building process, number of floors, number of dwellings, type of dwellings, structure characteristics, and characteristics of the building envelope. For further consideration with respect to the first six macro-categories, please refer to the specific bibliography [24] where the topic is discussed in detail. The fields in the remaining macro-categories (7-16) are 116 in total and are derived from processing performed on the first 95 inputs or information retrieved from existing databases.
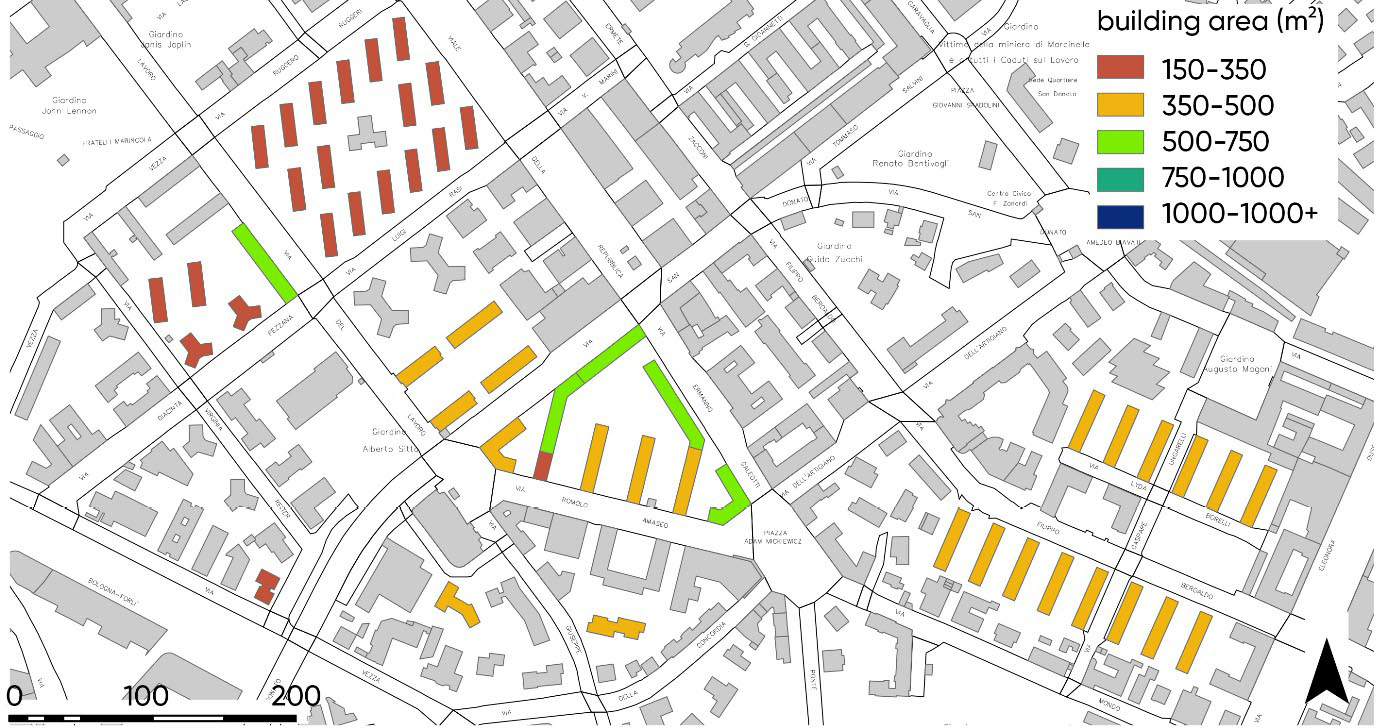
The “Imported Data - GIS” group includes 8 fields, with data derived from existing datasets [25], primarily processed by the Municipality of Bologna. These fields are linked to the database through the “GIS Building ID” attribute. The collected information includes, for example, the building’s neighborhood, the total floor area of the building (m²), its perimeter (m), the average value attributed to affordable housing in normal condition (€/m²), and the average value of civilian housing in excellent condition (€/m²), among others. Real estate valuation data is sourced from the Osservatorio del Mercato Immobiliare (real estate market observatory, hereafter referred to as OMI) databases, reflecting the average market values for a given area as of the first half of 2024. Figure 2 shows a portion of the buildings investigated in the San Donato area, colored according to size (building area).
The “Processing - Morphological Data” macro-category contains 17 attributes. These fields, defined as floats, provide quantitative information, primarily focusing on the size of the building and its main components. For instance, knowing the building height, the number of residential floors, and the base area allows for calculating its heated volume (m³). Similarly, this approach enables the processing of other data, including: heated side area (m²), total side area (m²), total number of windows, window area (m²), roof area (m²), and balcony area (m²), among others.
The “Processing - Economic Estimation Data” category, the smallest among all defined categories, contains only three fields. These attributes are related to the average building values and morphological characteristics and include the assumed values for cellars (€), parking spaces (€), and balconies (€).
The “Processing - Construction Characteristics” macro-category includes 29 attributes of various types (string, float, or integer). It contains information on the stratigraphy of floors across different levels, categorized as: basement floor slab, ground floor slab, inter-floor slab, and roof slab. The main constituent materials, thicknesses (cm), and additional data such as load-bearing capacity (if available), service limit state loads, and ultimate limit state loads are provided for each floor type. This category also defines the stratigraphy for each element that encloses the heated volume: vertical closure, base closure, and top closure.
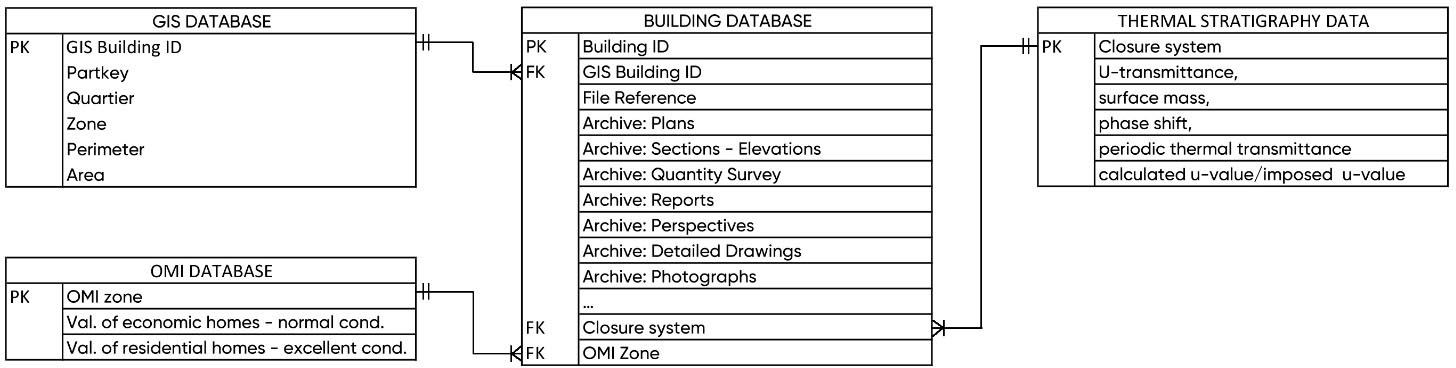
The “Processing - Energy Data” category consists of 21 attributes, all aimed at quantifying the building energy performance. This analysis required the creation of an additional database, running parallel to the primary one, in which the thermo-hygrometric characteristics of the components enclosing the heated volume were defined. For each component, using Termus-G software [26], the following were calculated: the U-transmittance, surface mass, phase shift, periodic thermal transmittance and the ratio of the calculated transmittance to that imposed by regulations. Figure 3 shows the logical data model of a part of the data structure.
The stratigraphy calculation data were further processed using climate data on heating and cooling degree days for the city of Bologna, retrieved from the CBE Clima Tool web application [27]. This allowed for the calculation of parameters such as: global heat loss through transmission in winter (kWh/year), global heat loss through transmission in summer (kWh/year), global heat loss through ventilation in winter (kWh/year), global heat loss through ventilation in summer (kWh/year), ideal energy demand in winter (kWh/year), and ideal energy demand in summer (kWh/year).
The “Processing - Space Organization and Functionality” macro-category contains 7 fields. The collected information includes indicators designed to provide a summary assessment of the quality of life for inhabitants. Key parameters include: the average number of inhabitants per housing unit, the number of inhabitants per toilet, the usable square meters per inhabitant, parking spaces per inhabitant, and the crowding index, which is calculated as the ratio of the main rooms in a unit to the number of inhabitants. In the study, the term “main rooms” refers to bedrooms, living rooms, dining rooms, and kitchens that are not incorporated into another room (kitchenette). Therefore, a two-room apartment in which a single inhabitant lives will have an index of 2, while the same apartment, this time inhabited by two people, will have an index of 1.
The categories (13-15), which relate to energy data, structural data, and space organization and functionality, follow the same approach and collect a total of 24 fields. Each of these three groups aims to assess building performance within its specific domain, providing an initial synthesis of the collected and processed attributes. Specific fields (5, 13, and 6, respectively) were included to evaluate this performance, each based on boolean logic (true or false). Each of the 24 values is derived from a logical expression designed to verify the presence or absence of a particular condition defined in advance. For example, the first potential criticality in the “Issues - Energy Data” category concerns the transmittance value of vertical closures. Like all fields in the three categories, this field accepts only true/false values; in this case, if the transmittance value exceeds the threshold set by current regulations, it returns true; otherwise, it returns false. The issues identified for the three groups include:
– high U (W/m2K) transmittance-vertical closure; high U (W/m2K) transmittance-base closure; high U (W/m2K) transmittance-top closure; high U (W/m2) transmittance-windowed surfaces; heating system inefficiency;
– elements-undersized to elevation loads-foundations; high degradation of materials-foundations; vertical-bearing structures-undersized to vertical loads; vertical-bearing structures-undersized to horizontal loads; vertical-bearing structures-high degradation of materials; horizontal-bearing structures-undersized to vertical loads; horizontal-bearing structures-deformable floors in their own plane; horizontal load-bearing structures-high degradation of materials; connections-absence connection of load-bearing element; connections-absence connection of load-bearing element-loft; structural configuration-significant torsional effects in case of earthquake; structural configuration-possible deformations concentrated on less rigid planes; nonstructural elements-high possibility of collapse of secondary-nonstructural elements to horizontal loads;
– inadequate private interior spaces; inadequate private exterior spaces; rigid interior organization; car parking inadequate to the number of inhabitants; need for elevator system; obsolete technological-plant systems;
The last macro-category, “building performance assessment - current situation”, consisting of seven fields, aims to summarize the state of the building in relation to all the data collected. Specifically, it reports: the number of energy performance issues, the number of structural issues, the number of space organization and functionality issues, the total number of issues; the ideal energy demand (kWh/year) and the building’s assumed value. Figure 4 shows the logical path from step 0 (source consultations) to the qualitative assessment of the building. Also shown diagrammatically are the parent-child relationships between the macro-categories.
At this point in the research, the collected data does not account for any variances during construction or punctual extraordinary maintenance work that may have been carried out over the years. It is believed that basing the data on a standardized source (in this case, the drawings required by the standard at the time) allowed for a consistent comparison across buildings, using a standard starting point. In addition, the underlying idea is that the original configuration of the building remained (in most cases) unchanged and that often the interventions were carried out for minor functional adaptations rather than total reorganization (structural, energy and distribution) of the buildings. Considering all the variants would require a volume of data that would make the system too complex to manage. Future applications could integrate interventions that made a substantial improvement in the performance of the entire building by preparing specific fields.
3. Queries and results
The sample of buildings dates from the two decades 1945-1965. As shown in Figure 5, the 468 buildings are distributed throughout the period rather unevenly.
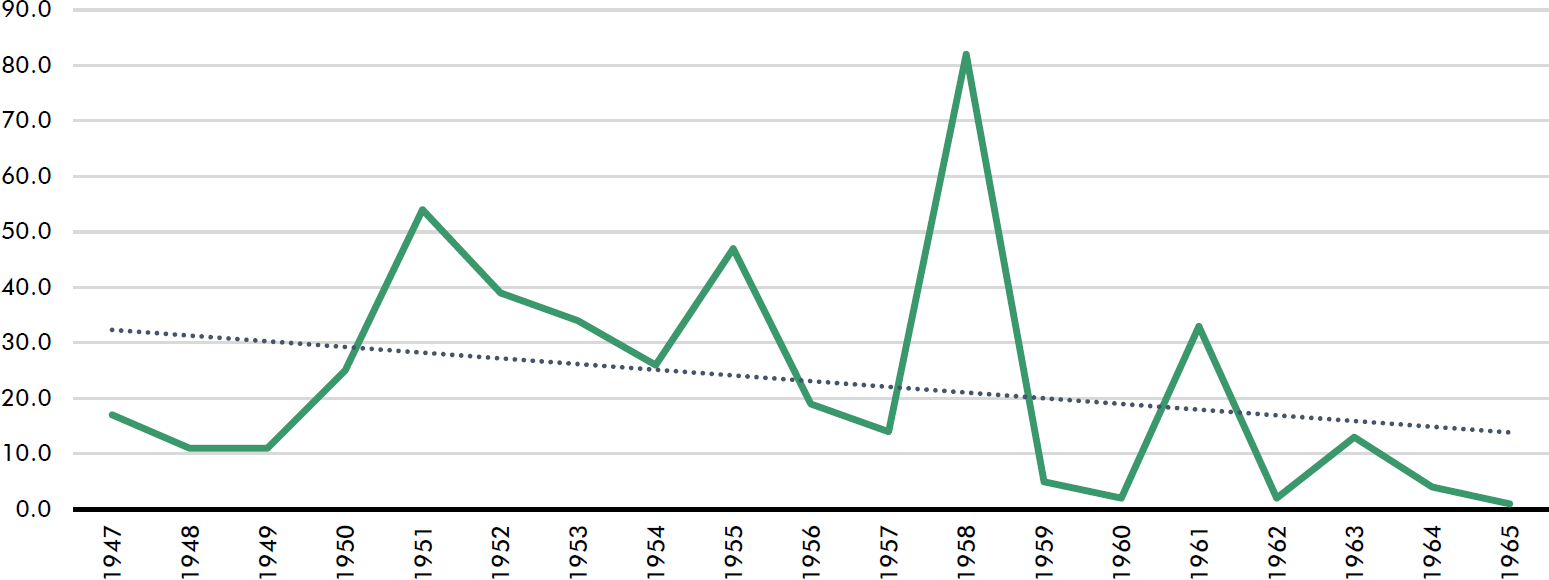
The largest number of buildings dates from 1951, 1955 and 1958, including 82 in 1958. The lowest values are evident in 1960 and 1962, with only two buildings constructed. The trend line, superimposed on the main curve, indicates intense activity in the early period, followed by a decline in construction, which became marked in the late 1950s.
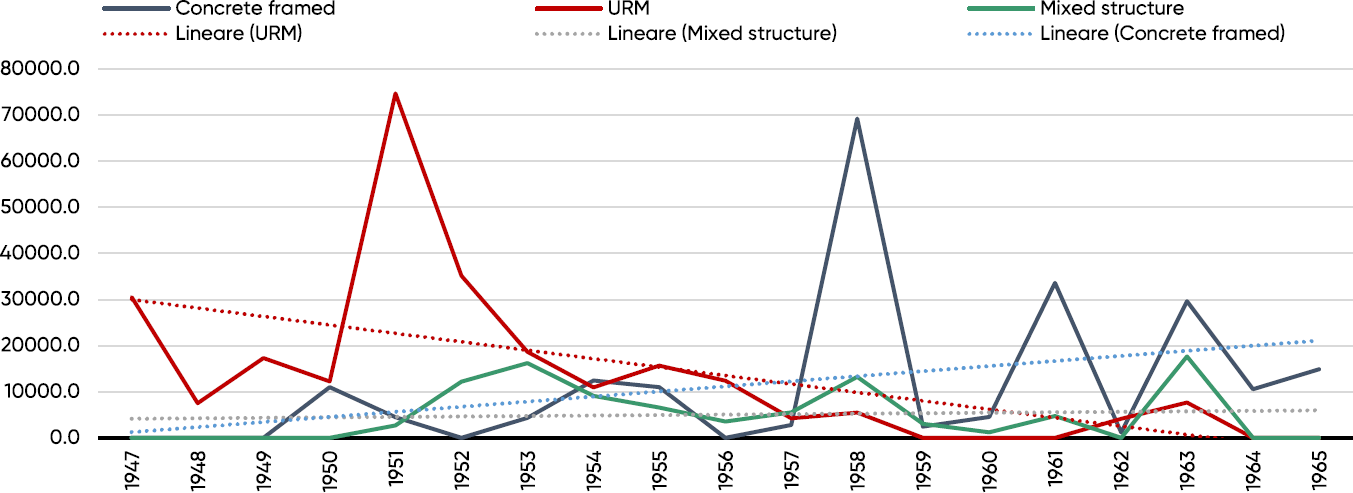
The stock of buildings analyzed showed three types of structures: concrete-framed buildings, unreinforced masonry (URM), and mixed structures (typically masonry perimeter structures and concrete center columns). URM buildings appear to be the majority (244), followed by concrete-framed buildings (147) and mixed-structure buildings (75). The graph in Figure 6 shows the square meters of usable floor area, realized by year, with respect to the system used. As before, the trend appears rather discontinuous and concentrated in two years: 1951 and 1958. The trend shows a massive use of masonry in the period following World War II, which quickly degraded and gave way to concrete-framed buildings beginning in the late 1950s. Mixed-structure buildings maintain a constant trend throughout the two decades.
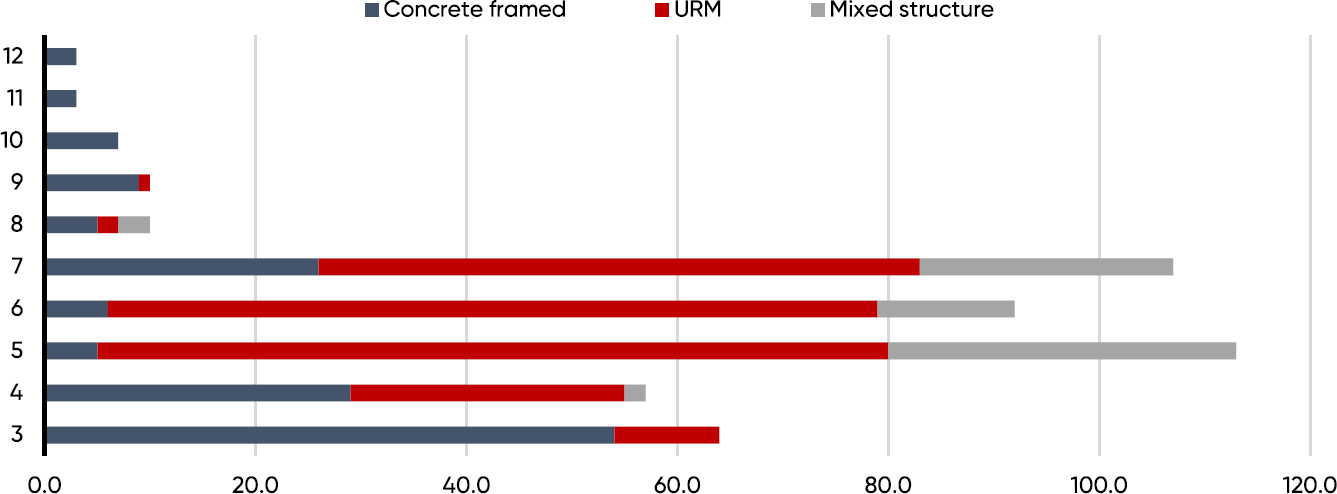
Observing the total number of floors that characterizes the sample of buildings (including basement and attic) is also interesting. Most of the buildings are made of five (113), six (92) or seven floors (107), also considering basements and roofs; very few buildings exceed eight levels. The late introduction of concrete for the execution of vertical structures has probably determined the maximum number of floors that could be built in residential buildings, given the mechanical limitations that imposed the use of two- or three-headed Bolognese masonry, which, compared with other parts of the world during the same period, is medium-density housing. The buildings analyzed are more developed planimetrically and maintain a low height, in line with the traditional building type prevalent in the area. Figure 7 shows this by comparing the number of floors, y-axis, with the buildings constructed, x-axis, according to the structural system used.
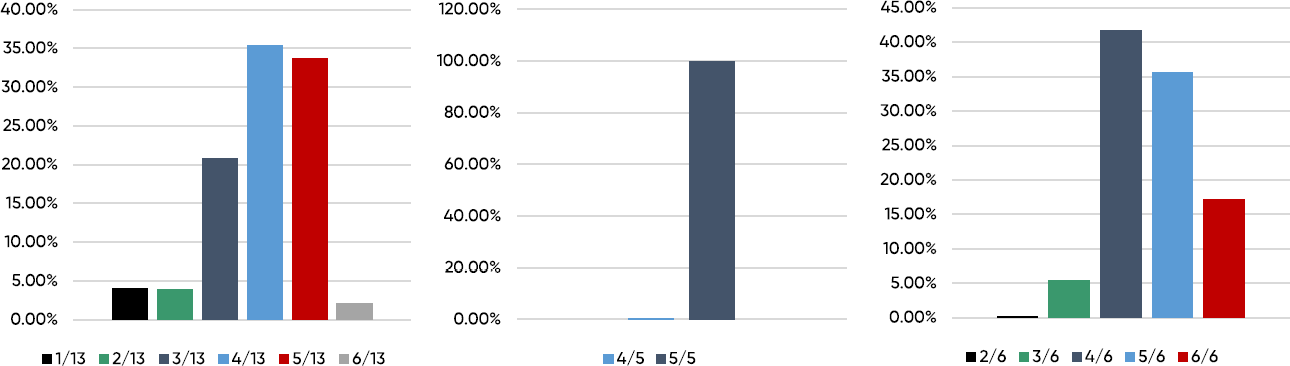
From a performance perspective, the building sample shows significant heterogeneity in terms of the defined issues. Structurally, the buildings present between 1 and 6 issues, with 13 being the maximum number of issues attributable to a single structure. The two extreme values (1 and 6) relate to less than 7% of the buildings, while 35.41% and 33.69% of the buildings present 4 and 5 issues, respectively. The most common issues are related to the high deformability of the floors (both in-plane and out-of-plane), irregular structural configurations (both in plan and in height), and vertical structures that are not always adequate to withstand the seismic demand expected for the site. The latter assessment is derived from a generalization of the conditions that determine seismic demand: these are buildings for residential use (defined exposure), all built in an area with similar characteristics, assumed topographic category T1, subsurface C and an acceleration of 0.167g (defined hazard). No problems were found in terms of foundations, where qualitative assessments were performed based on geognostic tests made available by the Emilia Romagna region [28], likely due to the presence of basements (low foundation level) and non-excessive loads (limited number of floors). The structural materials are generally assumed to be in good condition, although, as is well-known, the reduced concrete cover on structural elements favors the corrosion of reinforcement bars and the progressive loss of load-bearing capacity of the elements [29].
The situation is much worse from an energy performance standpoint; the buildings show 5 issues out of the 5 (maximum possible). All the building closures are inadequate: vertical closures, horizontal closures (base and top), and window surfaces. The transmittance values (W/m²K) are much higher than the standards required for such components. For example, the average transmittance of the vertical components in the sample is 1.56 W/m²K, a value in line with what has been observed in other projects [30], while in the city of Bologna, located in climate zone E, the maximum allowable value after renovation must be 0.28 W/m²K. Similar considerations apply to the other closure systems and windows.
The spatial and distributional organization presents a range of issues measured between 2 and 6, with 6 representing the maximum parameter. In percentage terms, buildings with 4 issues are the majority, accounting for 41.6% of the total, followed by those with 5, at 35.6%. These criticalities concern the lack of parking spaces, the absence of an elevator shaft (even in taller buildings), the lack of private outdoor spaces, and the inadequacy of internal spaces. The issues described in this macro-category are very common in the building sample, but they are the most challenging to resolve and would require a broader debate involving large-scale policy interventions. For instance, it might be more practical to build multi-level underground parking facilities serving an entire neighborhood rather than expensive and highly complex new underground garages for each individual building. Figure 8 shows briefly the number of structural issues, the number of energy performance issues, and the number of space organization and functionality issues detected in the group of buildings analyzed.
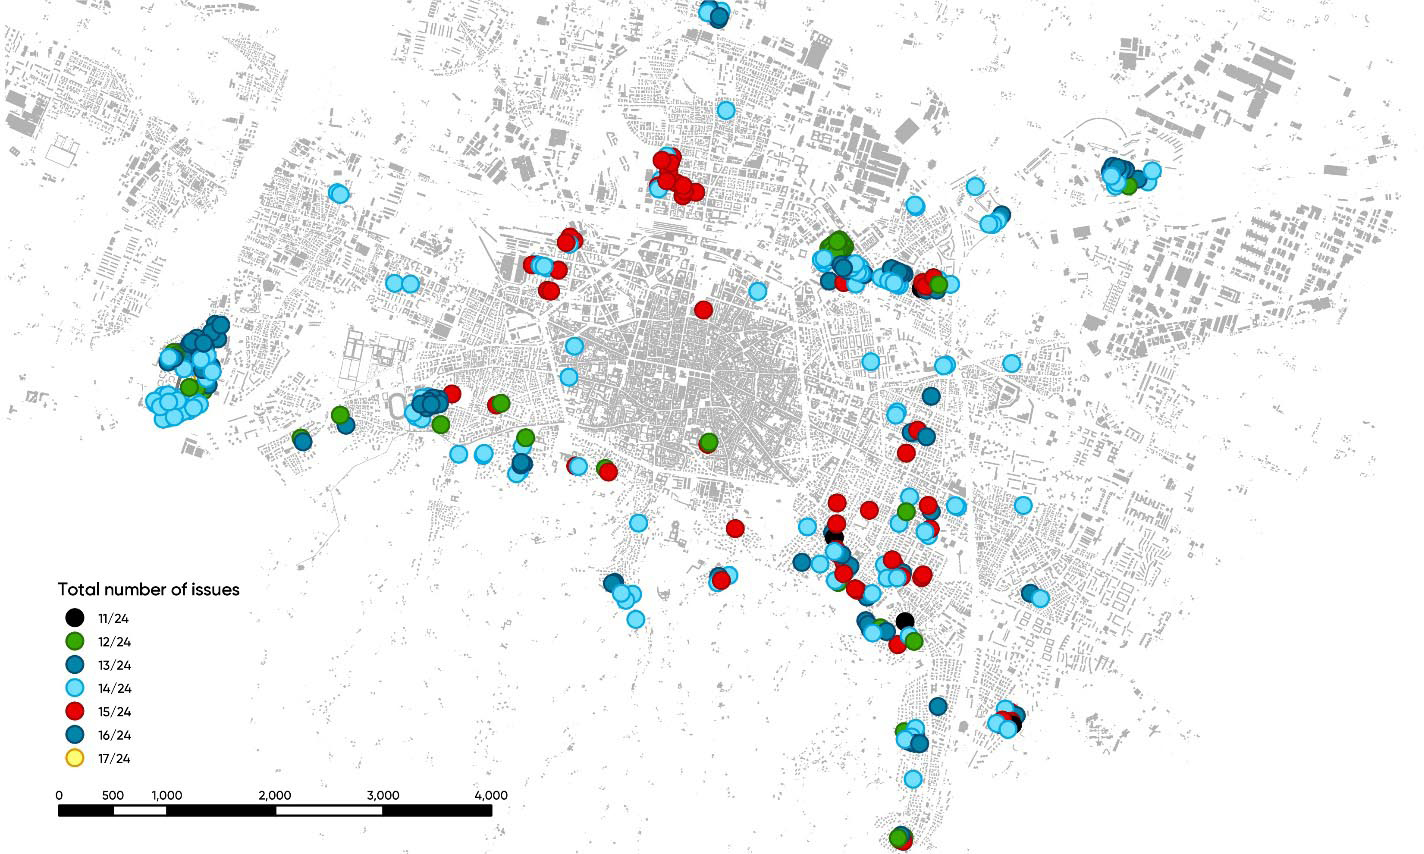
Overall, the sample exhibits a significant number of issues. Out of a total of 24 possible issues, the buildings present between 11 and 17, distributed in a Gaussian manner: the extremes concern less than 5% of the buildings, with percentages increasing as they approach the average value of 14, which applies to 45.3% of the sample. Figure 9 shows the map of Bologna in which the buildings investigated are indicated with reference to the total number of issues attributed to each of them.
4. Conclusions
The study focused on the development of a database designed to systematize and harmonize the information collected on a stock of 468 existing buildings constructed in the municipality of Bologna between 1945 and 1965. The work aimed to demonstrate how a functional data structure can lead to informed and targeted decisions for the reference sample. Specifically, the database consists of 468 autonomous records, characterized by 211 unique fields. These fields are grouped into 16 macro-categories to facilitate queries and enhance the readability of the recorded information. Data processing derived from the archival documentation led to the definition of new parameters, both quantitative (e.g., number of parking spaces per inhabitant, number of beds, transmittance of closure systems) and qualitative (e.g., need for elevators, inefficient structural configurations). Thanks to this data, it was possible to hypothesize the performance of the investigated buildings in terms of structure, energy efficiency, spatial/distributional organization, and overall assessment.
The sample revealed multiple criticalities across all three main investigated areas. Structurally, the buildings exhibited an average of 4 issues out of 13 total, with slabs identified as the weakest element. In terms of energy performance, the buildings averaged 5 issues out of 5, highlighting significant problems in reducing heat loss. Regarding spatial organization and functionality, the stock averaged 4-5 issues out of 6, showing shortcomings that negatively affect residents’ quality of life.
Queries provide an overview of building conditions that can be described both numerically and graphically, making data interpretation more intuitive. The outcome enables the design of intervention strategies targeted at individual buildings or the entire sample. Based on the large-scale results, resources can be allocated to perform a comprehensive analysis (field surveys, surveys, etc.) on the elements that have shown the most critical issues. For enhanced results, the system could be further developed by integrating artificial intelligence and a DSS, enabling predictive analyses and automating aspects of the decision-making process. The ability to modify or expand the input data provides opportunities to explore this approach further and adapt it to future specific research needs. For example, the following steps can include the most relevant building interventions (ignoring extraordinary maintenance confined to individual building units) that have been implemented over the years.
In conclusion, while recognizing the challenges (and costs) of implementing such a system on a large scale, the developed database offers a model for managing existing building stocks. It is compatible with specific DSS platforms that could promote more efficient resource allocation through a data-driven approach.
5. Authors Contributions
Conceptualization LS and GP , Data curation LS , Formal analysis LS, Investigation LS, Methodology LS and GP, Software LS, Validation LS and GP, Visualization LS , Writing original draft LS and GP, Writing – review & editing LS.
6. References
[1] Gonella G (2003) Il discorso delle 27 libertà, 1st ed., Gemma Editco, Verona
[2] ISTAT (2021) Abitazioni in edifici residenziali per epoca di costruzione e stato di occupazione - regioni e province. http://dati-censimentopopolazione.istat.it/Index.aspx?DataSetCode=DICA_EDIFICIRES. Accessed 17 Dec 2024
[3] Di Biagi P (2001) La grande ricostruzione: il piano Ina-Casa e l’Italia degli anni cinquanta. Donzelli, Roma
[4] Treves A (2001) Le nascite e la politica nell’Italia del Novecento. LED-Edizioni Universitarie di Lettere Economia Diritto, Milano
[5] Hrasnica M, Medic S (2021) Seismic Response of Unreinforced Masonry Buildings from 1950’s. In: 1st Croatian Conference on Earthquake Engineering. University of Zagreb Faculty of Civil Engineering, Zagreb, pp 1137–1148
[6] Siano R, Fatnassi A, Maio FVD, Basso P, Cademartori M (2023) Seismic vulnerability assessment and retrofitting design of Italian public buildings. Procedia Struct Integrity 44:1038–1044. https://doi.org/10.1016/j.prostr.2023.01.134
[7] Ma Z, Cooper P, Daly D, Ledo L (2012) Existing building retrofits: Methodology and state-of-the-art. Energy Build 55:889–902. https://doi.org/10.1016/j.enbuild.2012.08.018
[8] Loga T, Stein B, Diefenbach N (2016) TABULA building typologies in 20 European countries—Making energy-related features of residential building stocks comparable. Energy Build 132:4–12. https://doi.org/10.1016/j.enbuild.2016.06.094
[9] Manfredini A (1998) Cenni sui caratteri distributivi dei tipi razionalisti della residenza. In: Zaffagnini M (ed) Architettura a misura d’uomo. Pitagora, Bologna, pp 163–198
[10] Mathew PA, Dunn LN, Sohn MD, Mercado A, Custodio C, Walter T (2015) Big-data for building energy performance: Lessons from assembling a very large national database of building energy use. Appl Energy 140:85–93. https://doi.org/10.1016/j.apenergy.2014.11.042
[11] Geyer P, Schlüter A, Cisar S (2017) Application of clustering for the development of retrofit strategies for large building stocks. Adv Eng Inform 31:32–47. https://doi.org/10.1016/j.aei.2016.02.001
[12] Uva G, Leggieri V, Mastrodonato G (2021) An Approach for Tackling the Risk of the Residential Building Stocks at the Urban Scale Exploiting Spatial and Typological Archive Data. In: La Rosa D, Privitera R (eds) Innovation in Urban and Regional Planning. Springer International Publishing, Cham, pp 181–188
[13] Zuccaro G, Dolce M, De Gregorio D, Speranza E, Moroni C (2015) La scheda CARTIS per la caratterizzazione tipologico-strutturale dei comparti urbani costituiti da edifici ordinari. Valutazione dell’esposizione in analisi di rischio sismico. In: 34° Convegno Nazionale GNGTS, Trieste
[14] Krapf S, Mayer K, Fischer M (2023) Points for energy renovation (PointER): A point cloud dataset of a million buildings linked to energy features. Sci Data 10:639. https://doi.org/10.1038/s41597-023-02544-x
[15] Poux F, Billen R, Kasprzyk J-P, Lefebvre P-H, Hallot P (2020) A Built Heritage Information System Based on Point Cloud Data: HIS-PC. Int J Geo-Inf 9:588. https://doi.org/10.3390/ijgi9100588
[16] Ministero della Sanità (1896) Istruzioni Ministeriali 20 giugno 1896, compilazione dei Regolamenti locali sull’igiene del suolo e dell’abitato.
[17] Ministero per i Lavori Pubblici (1939) Regio decreto 16 novembre 1939 n.2229, Norme per l’esecuzione delle opere in conglomerato cementizio semplice od armato.
[18] Ministero dei Lavori Pubblici (1939) Regio decreto 16 novembre 1939 n.2228, Norme per l’accettazione dei leganti idraulici.
[19] Ministero dei Lavori Pubblici (1937) Regio decreto 22 novembre 1937 n.2105, Norme tecniche ed igieniche per le riparazioni, ricostruzioni e nuove costruzioni degli edifici pubblici e privati nei comuni o frazioni di comune dichiarati zone sismiche.
[20] Ministero dei Lavori Pubblici (1949) Legge 2 luglio 1949, n.408, Disposizioni per l’incremento delle costruzioni edilizie.
[21] Piano Incremento Occupazione Operaia (1949) Suggerimenti, norme e schemi per l’elaborazione e presentazione dei progetti, bandi dei concorsi. F. Damasso, Roma
[22] Colombo G (1877) Il manuale dell’ingegnere. Hoepli, Milano
[23] Gal M, Rubinfeld DL (2018) Data Standardization. SSRN Journal. https://doi.org/10.2139/ssrn.3326377
[24] Stefanini L, Predari G (2025) Building Characteristics of the Residential Asset in Bologna After World War II. In: Corrao R, Campisi T, Colajanni S, Saeli M, Vinci C (eds) Proceedings of the 11th International Conference of Ar.Tec. (Scientific Society of Architectural Engineering). Springer Nature Switzerland, Cham, pp 692–704
[25] Comune di Bologna (2024) Open Data Bologna https://opendata.comune.bologna.it/explore/dataset/rifter_edif_pl/information/. Accessed 17 Dec 2024
[26] ACCA Software S.p.A. Termus-G, version 42.00I. https://www.acca.it/calcolo-trasmittanza-diagramma-glaser-condensa.
[27] Betti G, Tartarini F, Nguyen C, Schiavon S (2024) CBE Clima Tool: A free and open-source web application for climate analysis tailored to sustainable building design. Build Simul 17:493–508. https://doi.org/10.1007/s12273-023-1090-5
[28] Servizio Geologico, Sismico e dei Suoli della Regione Emilia-Romagna (2024) Banca dati delle prove geognostiche della Regione Emilia-Romagna. https://ambiente.regione.emilia-romagna.it/it/geologia/servizi-e-strumenti/cartografie-webgis/prove-geognostiche-e-geotecniche-1. Accessed 17 Dec 2024
[29] Di Biase C (2009) Il degrado del calcestruzzo nell’architettura del Novecento. Maggioli, Santarcangelo di Romagna
[30] Corrado V, Ballarini I, Corgnati SP (2011) Building Typology Brochure – Italy. Fascicolo sulla Tipologia Edilizia Italiana. Politecnico di Torino, Torino