First Results Using Digital Image Correlation for Deformation Field Measurements in Laboratory Tests on Textile Reinforced Mortar (TRM)-strengthened Masonry Panels
1 Department of Civil, Environmental and Mechanical Engineering, Università di Trento, Italy
2 Department of Theoretical and Applied Sciences, eCampus University, Novedrate, Italy
3 Department of Science and Engineering of Matter, Environment and Urban Planning (SIMAU), Università Politecnica delle Marche, Italy
4 Department of Civil and Building Engineering and Architecture (DICEA), Università Politecnica delle Marche, Italy
Email: gianluca.maracchini@unitn.it; gianluca.chiappini@uniecampus.it; jacopo.donnini@staff.univpm.it; e.quagliarini@staff.univpm.it; v.corinaldesi@staff.univpm.it; s.lenci@staff.univpm.it; f.monni@univpm.it
*Corresponding author
Abstract. The Digital Image Correlation (DIC) technique is a non-contact, full-field optical method and a non-destructive evaluation approach that enables the measurement of displacements and strain fields across an entire surface during experimental tests. This technique provides high-resolution data, enabling the measurement of global strain, the detection of localized strain concentrations and crack initiation, and monitoring the evolution of dominant damage mechanisms. DIC’s ability to capture both in-plane and out-of-plane displacements makes it a powerful tool for detailed structural assessment. This paper presents preliminary results on the application of the DIC technique during diagonal compression tests of 1.2 × 1.2 × 0.25 m³ unreinforced and strengthened clay brick masonry panels. The strengthening system consists of two Textile Reinforced Mortar (TRM) layers applied on both wall sides and connected by helical stainless-steel connectors. Glass fiber bidirectional fabrics are used as TRM reinforcing meshes, embedded in a 30 mm thick lime-based mortar. A couple of CMOS cameras were used to apply the stereo-DIC algorithm and record the three-dimensional displacement field during test execution. The displacement field obtained through DIC has been compared and validated with that obtained through the more common analog Linear Variable Differential Transformers (LVDT). The comparison highlighted the benefits and weaknesses of the DIC technique.
Keywords: DIC, TRM, masonry, laboratory test, diagonal compression test, shear modulus.
1. Introduction
In recent decades, the topic of strengthening existing structures has been one of the most extensively investigated by researchers in the field. This interest encompasses both performance under static loads and resistance to seismic actions. Particular attention has been directed toward the reinforcement of masonry structures, both due to their widespread use and because they often involve buildings of significant architectural heritage [1-3]. This growing interest within the scientific community has driven the advancement of innovative strengthening techniques [4-7], particularly those leveraging composite materials. Composite materials are increasingly employed in structural repair and retrofitting due to their exceptional strength-to-weight ratio, minimal impact on structural mass, ease of application, and versatility. These systems typically consist of high-strength textiles, which may be unidirectional or multidirectional, and are fabricated from materials such as aramid, basalt, carbon, glass, PBO, steel, or natural fibers like flax, hemp, and jute. The textiles adhere to structural surfaces using organic matrices, such as epoxy, polyester, polyurethane resins, or inorganic matrices, including cement or lime mortars. Organic matrix systems are classified as Fibre/Steel Reinforced Polymers (FRP/SRP) when epoxy resins are utilized [8], or Fibre/Steel Reinforced Polyurethanes (FRPU/SRPU) when polyurethane matrices with high deformability are employed. In contrast, mortar-based systems are known as Fabric Reinforced Cementitious Matrix (FRCM), Textile Reinforced Mortar (TRM) [9], or Steel Reinforced Grout (SRG) when steel textiles are used.
The validation and performance assessment of reinforcement systems utilizing these materials, as well as the engineering and optimization of detailed aspects (e.g., compatibility between reinforcement and matrix), necessitate experimental campaigns, often involving full-scale specimens. Such tests are essential for obtaining reliable results that can support the development of analytical models used by designers in the sector. To accurately understand the mechanical behavior of specimens subjected to such tests, it is essential to record both the loads applied to the tested specimens and their corresponding deformations.
Standard test methods for determining mechanical properties of masonry assembly generally prescribe the use of Linear Variable Differential Transformers (LVDTs) to monitor displacements during tests. If properly used, these instruments have a virtually infinite life cycle, but they can incur damage if adopted in destructive tests, causing high repair or replacement costs. Some standards recognize this problem, allowing the removal of the LVDT instrumentation before reaching the specimen collapse, ASTM E519-22 [10].
Moreover, in these cases, crack formation or non-uniform load distribution may affect the results without being properly detected, especially when matrix damage may disrupt the reading of the measurement devices, making displacement data unavailable, unreliable, or not representative of the global behavior.
In addition, the use of traditional sensors can, in some cases, complicate the experimental setup preparation for various reasons: their size can be problematic (particularly with small specimens), they often require initial calibration, and they need to be mechanically fixed to the specimen (typically through adhesive bonding, although mechanical fastening is required when the substrate does not permit adhesion). Finally, these sensors are sensitive to voltage fluctuations and provide data limited to the specific portion of the specimen where they are applied.
To overcome these drawbacks, in the last few years, several full-field contactless optical measurement techniques have been developed for measuring displacements during experimental tests in place of more common LVDTs [11-13]. Among others, the Digital Image Correlation (DIC) technique has become one of the most promising measurement methods, obtaining significant information on the strain state of the material/structure with a complete reconstruction of the crack pattern [14]. For this reason, it has been widely used in several fields, reaching a relatively advanced knowledge of testing setups and data processing [15-20]. The accuracy of such a technique is undoubtedly growing as the resolution of the optical recording instruments increases.
DIC is a contactless full-field optical technique for measuring displacements during experimental tests that can be potentially used in place of LVDT instrumentation to avoid damaging instrumentation during tests of full-scale walls. However, despite DIC being successfully used in several fields, such as for the characterization of building materials [21-22], its potential application in testing full-scale walls has not yet been thoroughly investigated [23].
For this reason, this paper presents the preliminary results of an experimental campaign to evaluate the potential of the DIC technique for monitoring the displacement of masonry walls during experimental tests. In particular, the results of diagonal compression tests on two unreinforced and two strengthened masonry walls with dimensions of 1.2 × 1.2 × 0.25 m3 are reported. The adopted strengthening system consists of two layers of TRM, which is a promising alternative to fiber-reinforced polymer (FRP) composites or the shear and out-of-plane strengthening of existing masonry structures due to their higher compatibility with historic masonry substrates, higher vapor permeability, reversibility, and resistance to UV radiation and high temperatures [24-26].
A stereo-DIC technique was used to record the three-dimensional displacement field during diagonal compression tests. A comparison between DIC results and those obtained through the more common analog LVDTs is reported. Finally, the nominal tangential elastic moduli obtained from the two measurement systems are computed and compared.
2. Materials and methods
2.1. Materials
Four masonry walls with dimensions of 1.2 × 1.2 × 0.25 m³ were built using fired clay bricks measuring 250 × 120 × 55 mm³ (with an average compressive strength of 30 MPa) and commercially available lime mortar in 10 mm thick joints. Two of these walls (M1, M2) were left unreinforced, while the other two (MR1, MR2) were reinforced using a Textile Reinforced Mortar (TRM) system applied to both sides of the walls.
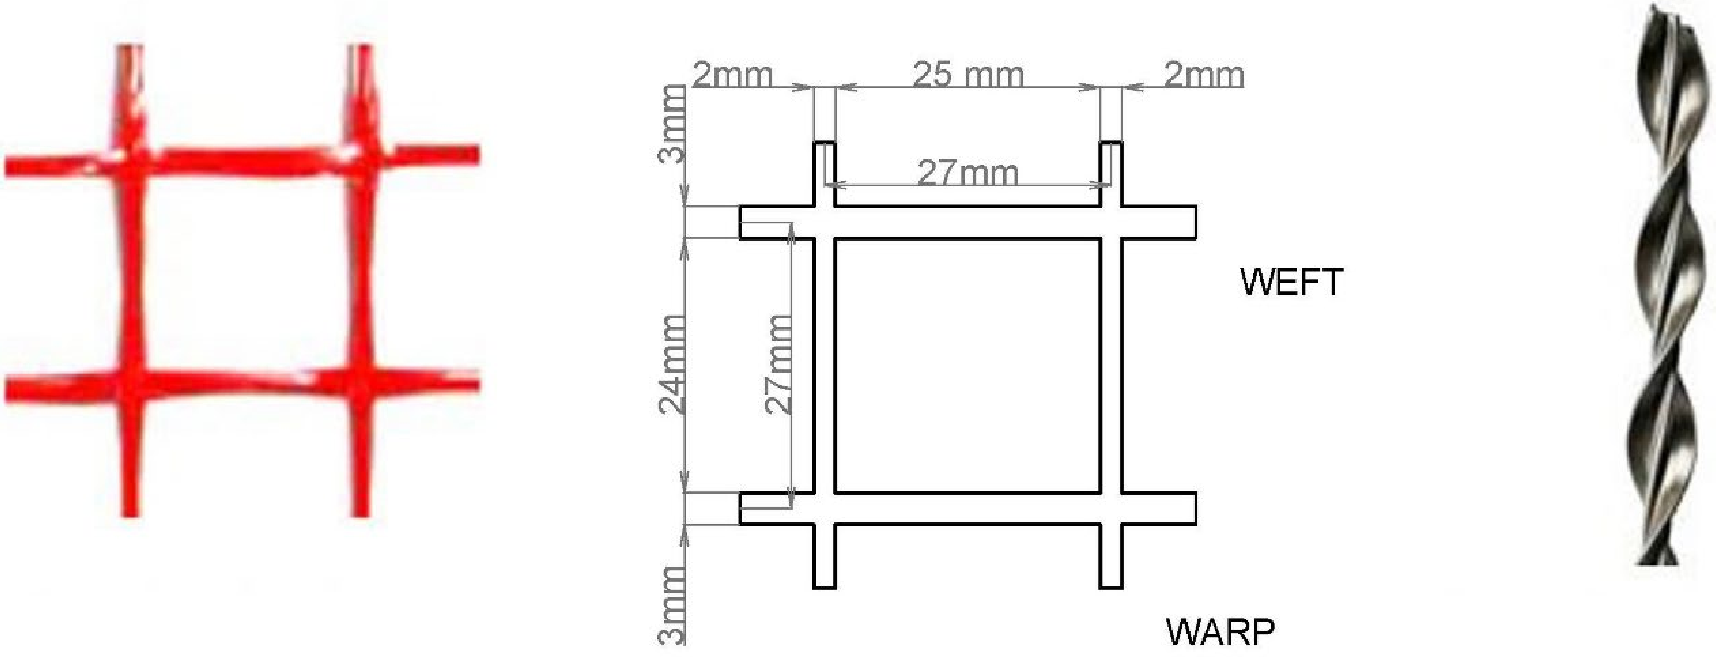
The TRM reinforcement system consisted of a bidirectional alkali-resistant (AR) glass fiber grid (density 280 g/m2) coated with a polyvinyl alcohol layer (Fig. 1). This grid was embedded in a 30 mm thick layer of a fiber-reinforced, hydraulic lime-based matrix. To enhance the connection between the TRM layers and the wall, stainless-steel helical connectors with a nominal diameter of 8 mm and a tensile strength of 830 MPa (as provided by the manufacturer) were installed (Fig. 1). These connectors were bent over the glass fiber grid for a length of approximately 100 mm, ensuring a robust mechanical bond. A similar TRM reinforcing approach was tested and described in detail in [27].
The geometrical and mechanical properties of the glass fiber yarn of the fabric are provided in Table 1, while the mechanical characteristics of the inorganic mortar, evaluated following EN 1015-11 [28] and EN 12504-4 [29], are 100 summarized in Table 2.
| Material | s [mm] | fft [MPa] | εf [%] | Ef [GPa] |
|---|---|---|---|---|
| Warp yarn | 0.0339- | 1600 | 1.7 | 58 |
| Weft yarn | 0.0339- | 1570 | 1.7 | 61 |
| Material | fMc [MPa] / COV (%) | fMb [MPa] / COV (%) | Ed [GPa] / COV (%) |
|---|---|---|---|
| Masonry mortar | 4.78 / 4.73 | 1.78 / 0.91 | 9.25 / 1.30 |
| TRM matrix | 8.35 / 2.86 | 3.56 / 3.89 | 12.32 / 1.10 |
2.2 Methods
The tests were carried out according to the standard ASTM E519-22 [10]. A monotonic force-controlled diagonal load with a loading rate of about 1 kN/s was applied on the bottom corner of the specimens using six hydraulic jacks with a total compression capacity of 3000 kN, similar to the ones used in [30-32]. The experimental setup is reported in Fig. 2.
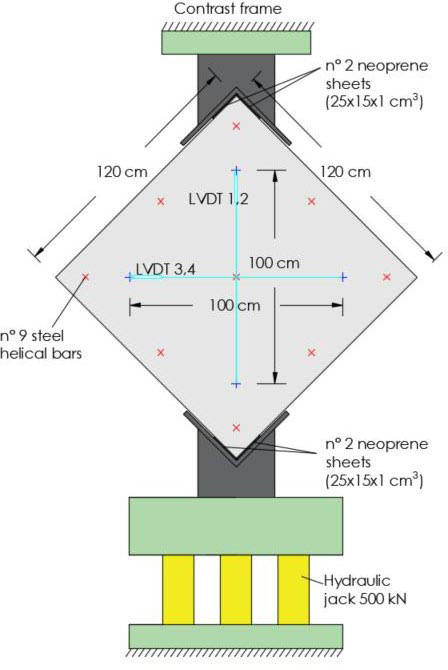
To minimize friction, ensure uniform load distribution, and avoid directly loading the two TRM reinforcement layers, neoprene pads were placed at the loaded corners of the masonry walls. To monitor displacements during the tests, four Linear Variable Differential Transformers (LVDTs) were installed on the wall surfaces, with two sensors on each side (see Fig. 2).
The data from the LVDTs were recorded using a Spider8 data acquisition system running Catman software, operating at a sampling frequency of 2 Hz. Among the LVDTs, sensors LVDT 1 and LVDT 3, positioned on the wall face monitored by the Digital Image Correlation (DIC) system, were employed to measure horizontal and vertical displacements, respectively, for comparison with the results obtained through the DIC technique.
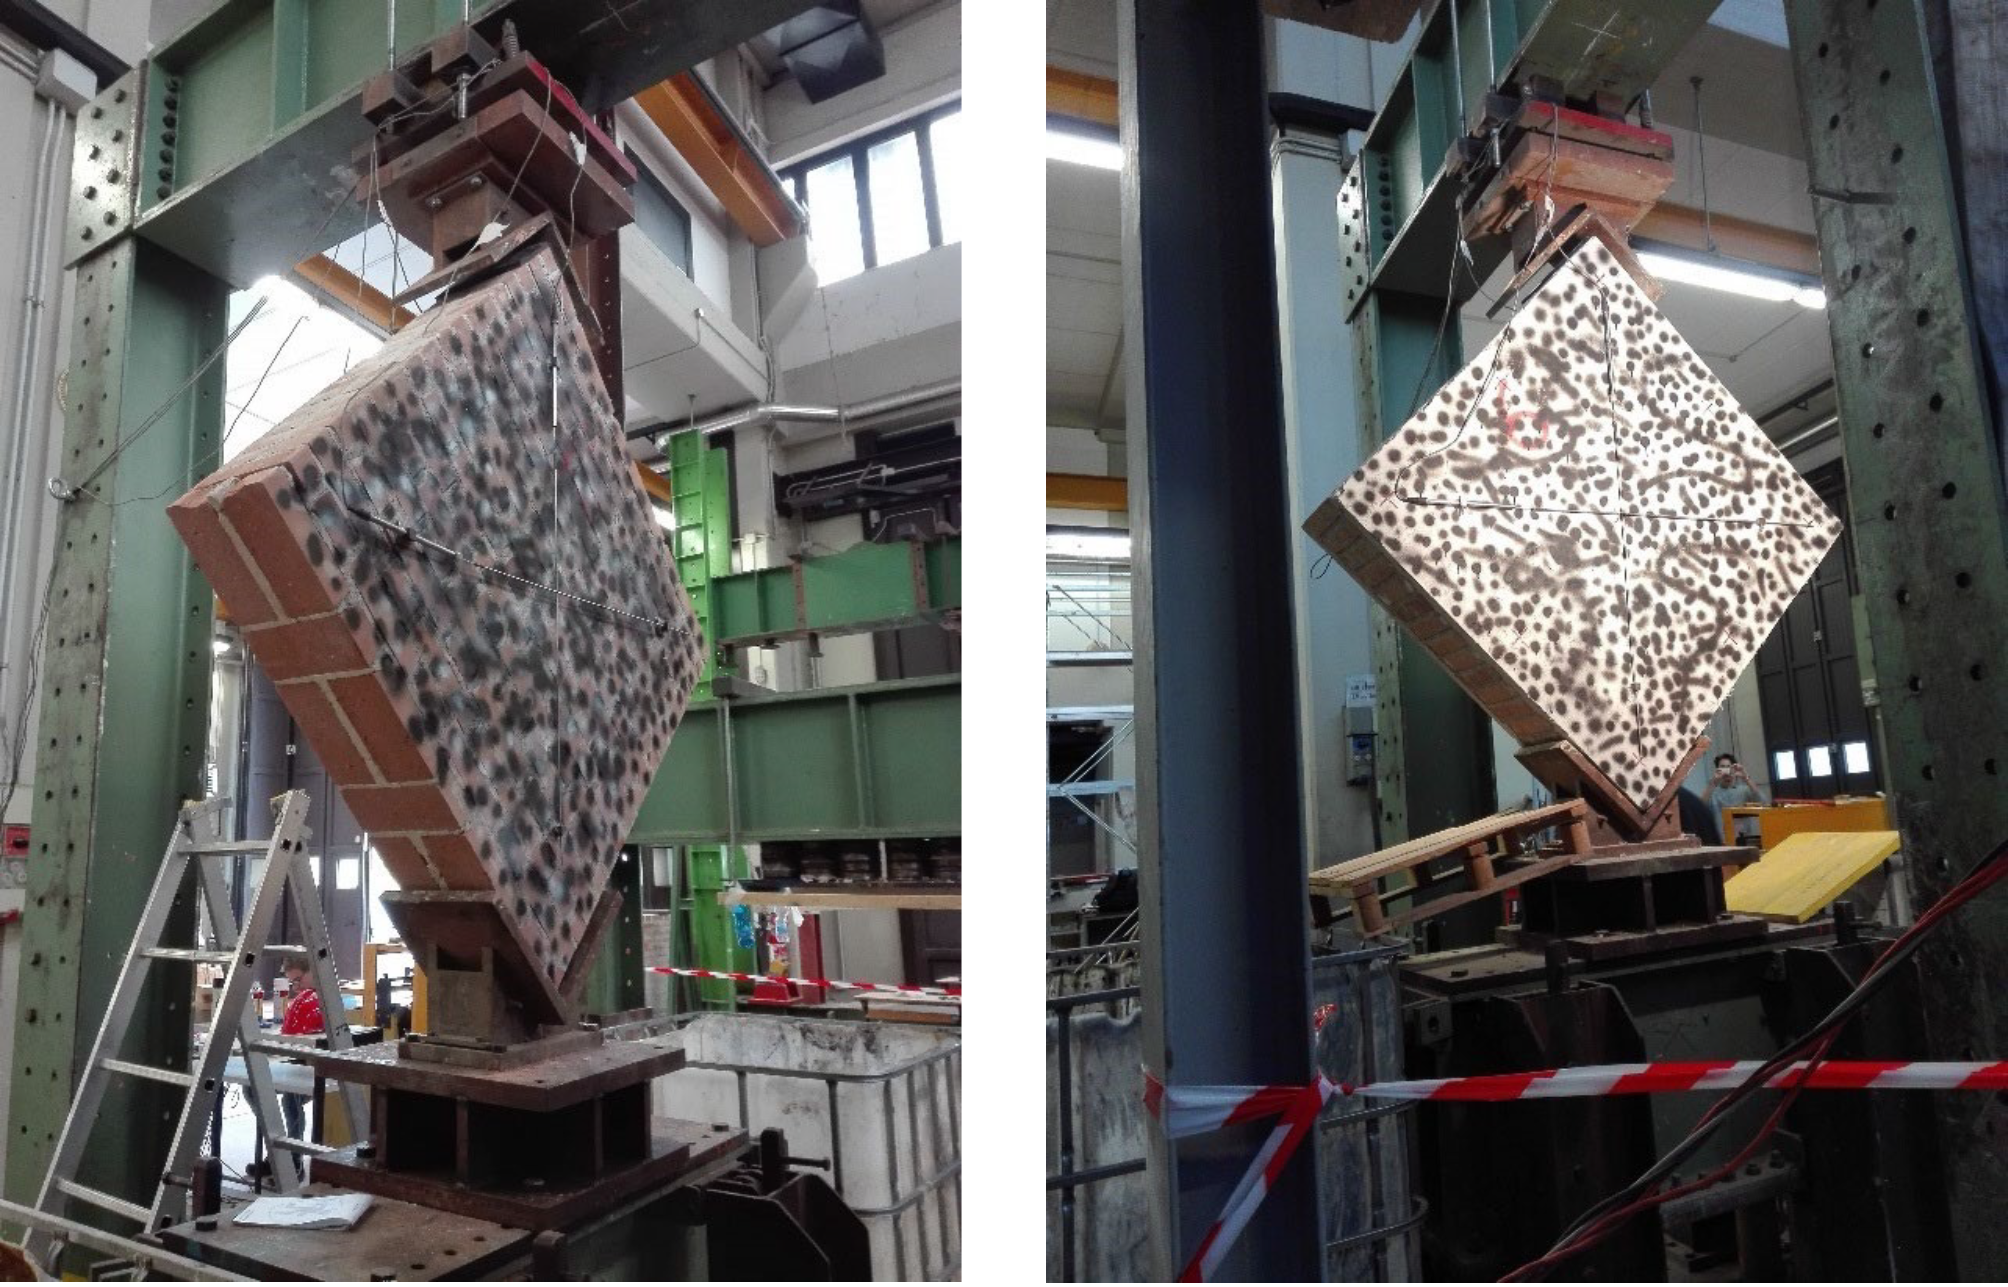
For the strengthened masonry panels, the LVDTs were mounted directly onto the surface of the TRM layers (see Fig. 2), ensuring that the displacement measurements accounted for the behavior of the reinforced assembly. This setup enabled an accurate evaluation of the consistency between traditional point-based measurement techniques and the DIC method, providing insights into the reliability and applicability of DIC for tracking displacement fields in both unreinforced and reinforced configurations. As an example, Fig. 3 shows the images of an unreinforced and a reinforced specimen before the execution of the diagonal compression test.
For the scope of this work, the nominal stresses were computed by referring to the masonry section only, i.e., without considering the thickness of the two TRM layers. Future studies will verify the accuracy of this assumption to determine the actual mechanical properties of the strengthened masonry walls. Then, the nominal shear stress was computed as τ = 0.707 P/An according to ASTM E519-22 [10], where P and An are the applied load and the net cross-sectional area of the unreinforced masonry wall, respectively. The shear strain was obtained through LVDT measurements as γ = εv + εh, where εv and εh are the average strains, in absolute value, along the compressive and tensile diagonals of the panels. Then, the shear stiffness modulus of the wall (G) was computed by linear regression of the τ-γ experimental curve between 10 and 40% of the maximum strength.
2.3. Digital Image Correlation
The displacements and the strains of the wall surface were measured by using a 3D-DIC technique, which consists of the acquisition, during tests, of digital pictures of the frontal surface of the specimen, previously painted with a speckle pattern with black and white dots (or with black dots only in the strengthened case due to the light gray surface) and illuminated by a halogen lamp. In this work, two complementary (CMOS) digital cameras (model Pixelink® B371F) were used. The main characteristics of the cameras are given in Table 3.
| Camera 1 | Camera 2 | ||
|---|---|---|---|
| Sensor | [Type] | CMOS | CMOS |
| Sensor pixel size | [μm] | 6.8 × 6.8 | 6.8 × 6.8 |
| Sensor resolution | [pixel] | 1280 × 1024 | 1280 × 1024 |
| Frame rate | [fps] | 2 | 2 |
| Lens | [Type, mm] | C mount, 25 | C mount, 25 |
| Working distance | [mm] | 2500 | 2500 |
| Sensor noise | [gray level, dB] | 0.94, −19 | 0.94, −19 |
| Subset size | [pixel, mm] | 20, 30 | 20, 30 |
| Displ. accuracy (st. dev) | [pixel, mm] | ±[0.02, 0.05] | ±[0.02, 0.05] |
| Strain accuracy (st. dev) | [mm/mm] | ±0.0001 | ±0.0001 |
| Calibration data | |||
| fx – fy | [pixel] | 1830 - 1828 | 1815 - 1809 |
| cx – cy | [pixel] | 716 - 480 | 583 - 488 |
| Tx – Ty – Tz | [mm] | 450 – 593 – 2874 | |
| αx – αy – αz | [rad] | 0.3491 – 0.0557 – 0.8327 |
The cameras were calibrated in a common global system by means of the Matlab Calibration Toolbox. Calibrating a stereo vision sensor is required for determining the intrinsic parameters of each camera and the relative position and orientation, and then to compute, by stereo-triangulation, the 3-D coordinates of a point corresponding to matched pixels on the two images. In this work, the calibration procedure involved repeated acquisitions of a regular target (consisting of a 10×10 dots grid, 100 mm pitch, and 40 mm of dot diameter), moved in different positions within the working volume. Calibration data are presented in Table 3, which also reports the quantitative calibration errors, expressed as the standard deviations of the displacement measurements and the resulting strains. These values were obtained by acquiring a series of stationary images prior to specimen testing. This procedure was employed to evaluate the performance of the correlation technique and the accuracy of the strain measurements. No systematic bias was detected, as the average strain values show small random fluctuations around zero. The standard deviations are approximately constant and are on the order of 100 microstrain.
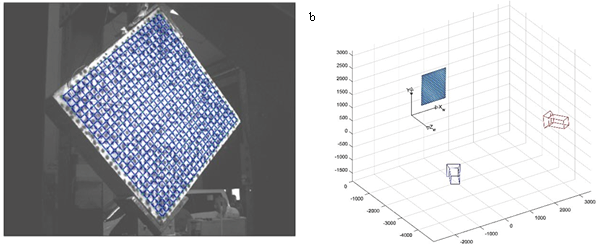
Fig. 4a shows a typical picture recorded by one camera with an overlaid measurement grid. The subsets discretization used for the DIC analysis was 20×20 pixels, with a measurement point every 30 mm. The subset size of 20 × 20 pixels was selected as a compromise between spatial resolution and correlation robustness, in accordance with previous studies [13] Fig. 4b shows the 3D grid calculated by stereo triangulation with the schematic position of the two frontal cameras.
After testing, the digital images acquired were post-processed by an in-house developed 3D-DIC software. The grid of the elements is initially defined on the undeformed image of camera 1. To determine the corresponding grid on the undeformed image of camera 2, the epipolar constraint given by the fundamental equation of Longuet-Higgins (1) is used:
(1)
where and are the corresponding points of the two cameras, and F is the essential matrix depending on the calibration parameters of the cameras. Based on global DIC, the correlation method between the deformed images incorporates the same epipolar constraint and the assembling approach of the Finite Element Method. The displacements of all grid measuring points were obtained by minimizing the correlation error computed all over the current frame with respect to the reference frame [33] calculated with the following expression:
(2)
where Xd and Xu indicate the coordinates of the deformed and undeformed grid nodes, respectively, while Sid and Siu indicate the sub-images associated with the i-th element on the deformed and undeformed image.
The zero-mean sum of square difference (ZSSD) criterion was adopted to avoid the effects of lighting offset and inhomogeneity. Outputs were obtained by referring to the right-handed coordinate system shown in Fig. 4. Strains (εx, εy, and γ) were computed using the Cauchy-Green theory, starting from the 3D node displacements.
3. Results
In Fig. 5, the results of the diagonal compression tests in terms of nominal τ-γ curves are reported. The unreinforced walls were characterized by quite a linear behavior until reaching the maximum shear stress (about 0.9 MPa), after which the sudden collapse of the specimen occurred due to the reaching of the principal tensile strength of the masonry near the wall center. As expected, a slightly stiffer (and stronger) behavior is obtained for the strengthened panels, characterized by a first linear part of the curve until the crack of the TRM layers (at about 1.3 MPa), also reaching a higher deformation value. No detachment at the TRM matrix-to-substrate interface was observed during the test, indicating a good bond of the inorganic mortar with the masonry substrate.
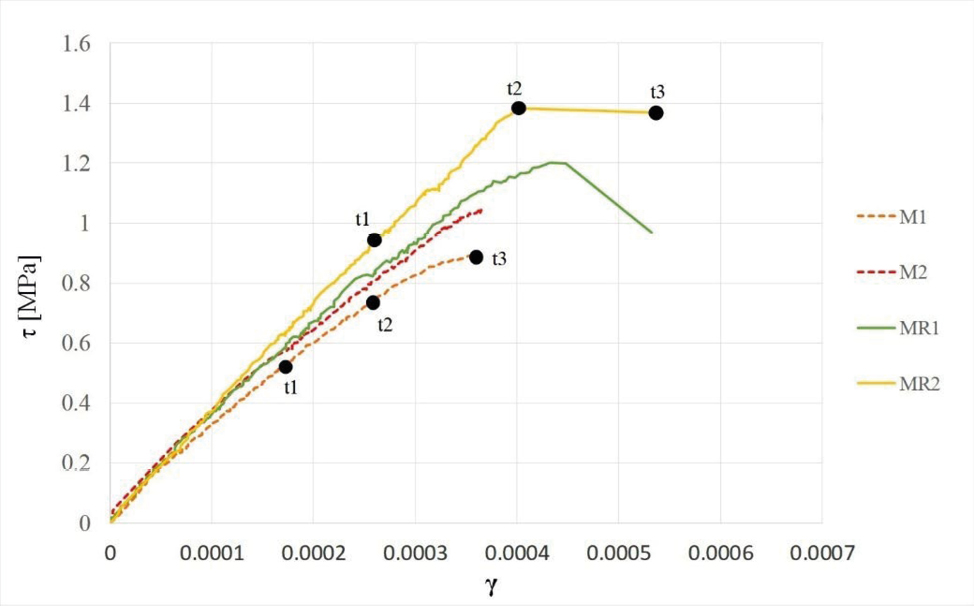
Fig. 6 and Fig. 7 show horizontal, vertical, and out-of-plane displacements (dx, dy, and dz, respectively) obtained from DIC measurements for two representative walls (M1 and MR2, respectively). In particular, the displacements related to 3 different moments during the test are plotted (t1, t2, and t3, see Fig. 5). Specifically, for the strengthened masonry wall, t₁ corresponds to the moment when the initial cracking occurred t₃ marks the end of the test, and t₂ represents an intermediate point in time between t₁ and t₃. For the unreinforced masonry wall, t₃ corresponds to the instant at which the specimen failed; t₁ refers to the moment when the applied load reached half of the peak (failure) load; and t₂ represents the intermediate time instant between t₁ and t₃.
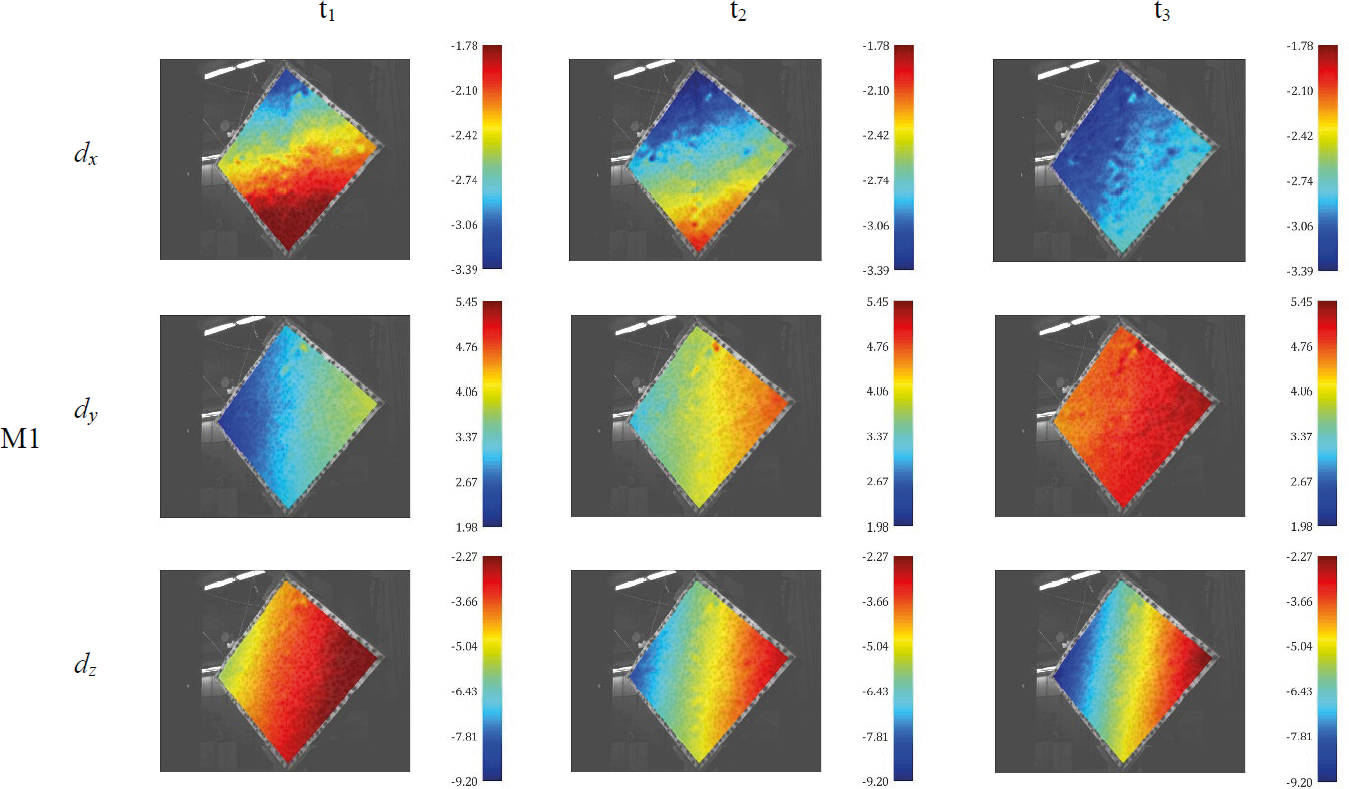
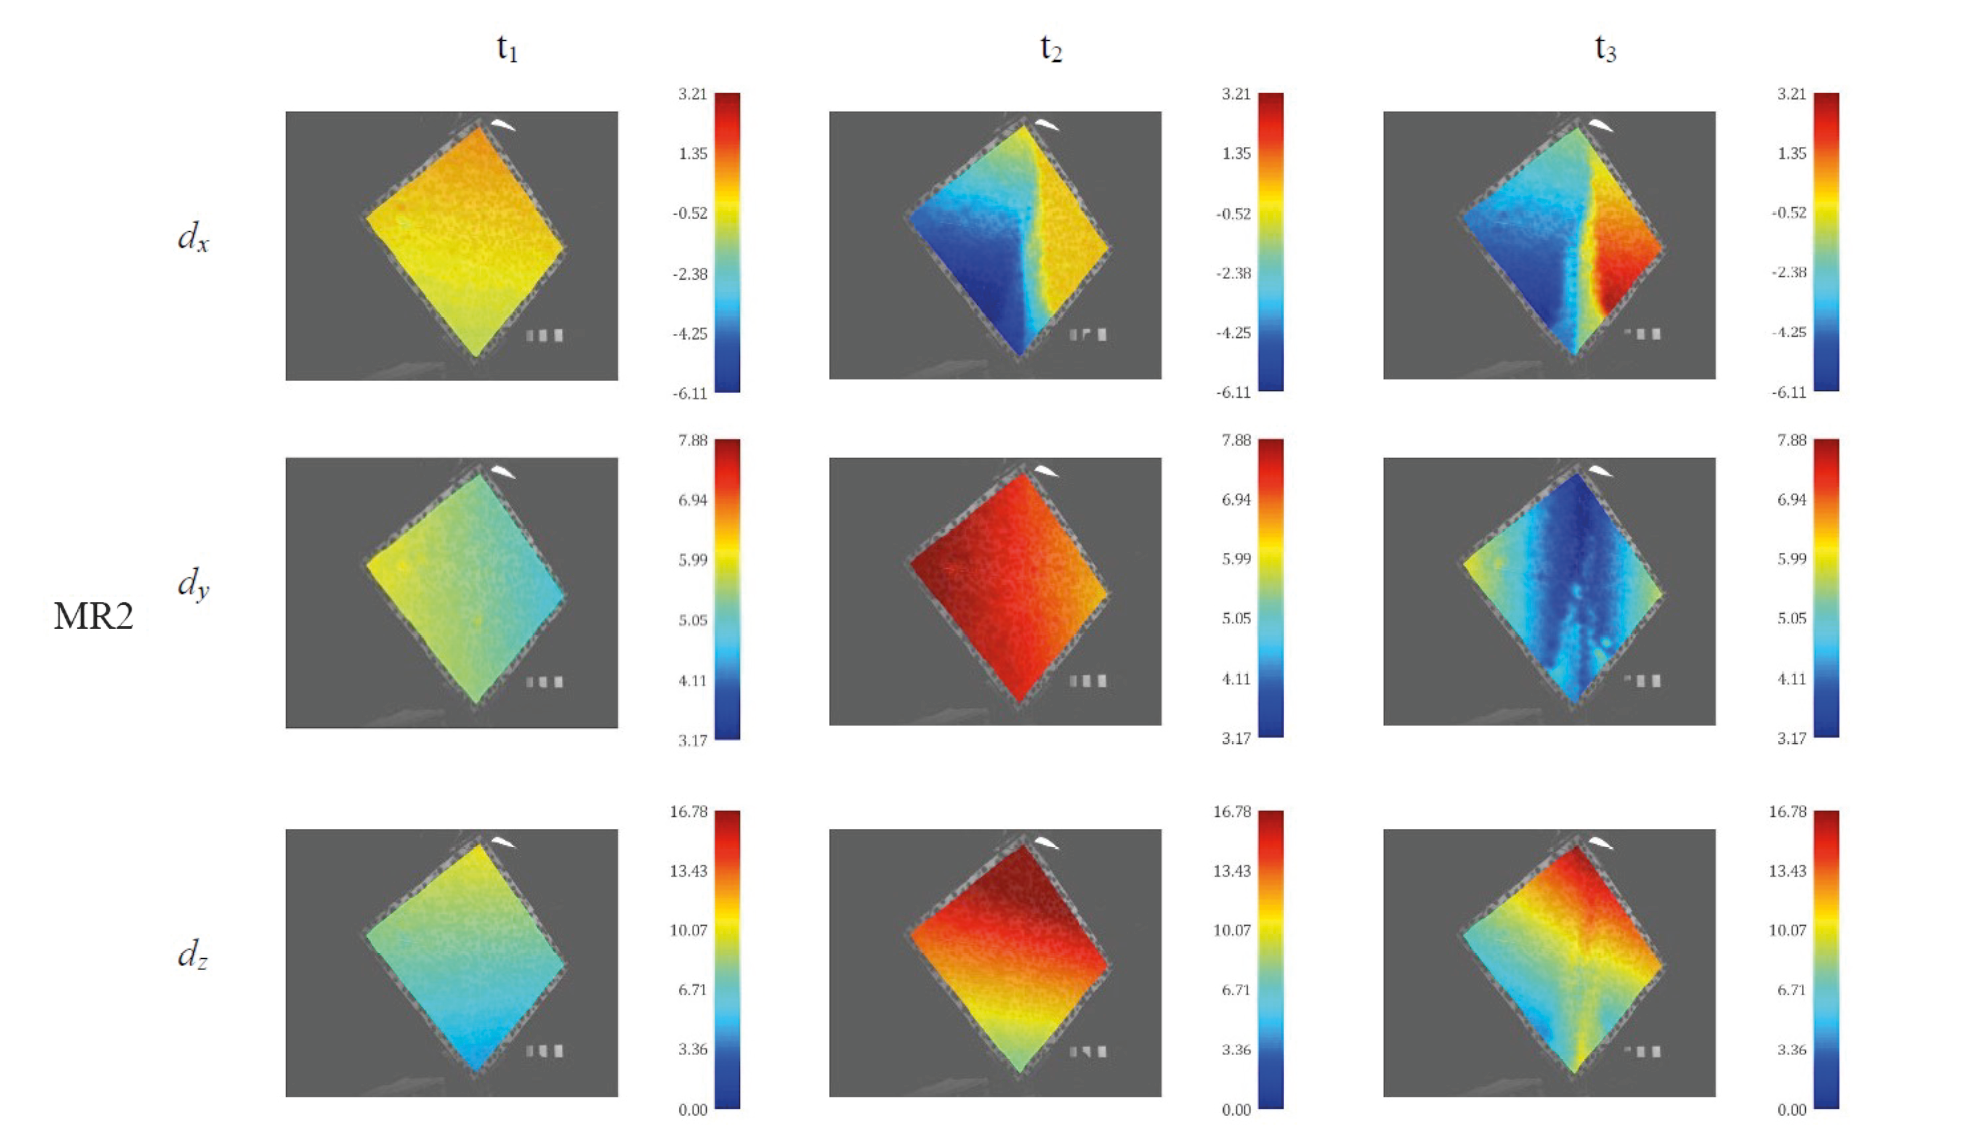
From the dx and dy displacement maps, it is possible to observe that, during the test, the masonry walls were not subject to a uniform upward displacement, but they had a slight rotation with respect to the normal axis of the masonry wall surface. Moreover, dz allowed verifying the occurrence of out-of-plane rigid rotations of the walls. This behavior cannot be observed if a bidimensional DIC algorithm is adopted. Comparing the maps, it can be observed that the unreinforced wall has a brittle behavior, while the strengthened one has a ductile behavior. In fact, at the maximum load of the strengthened panel (t2), multiple cracks propagated through the TRM layer until the panel collapses (t3).
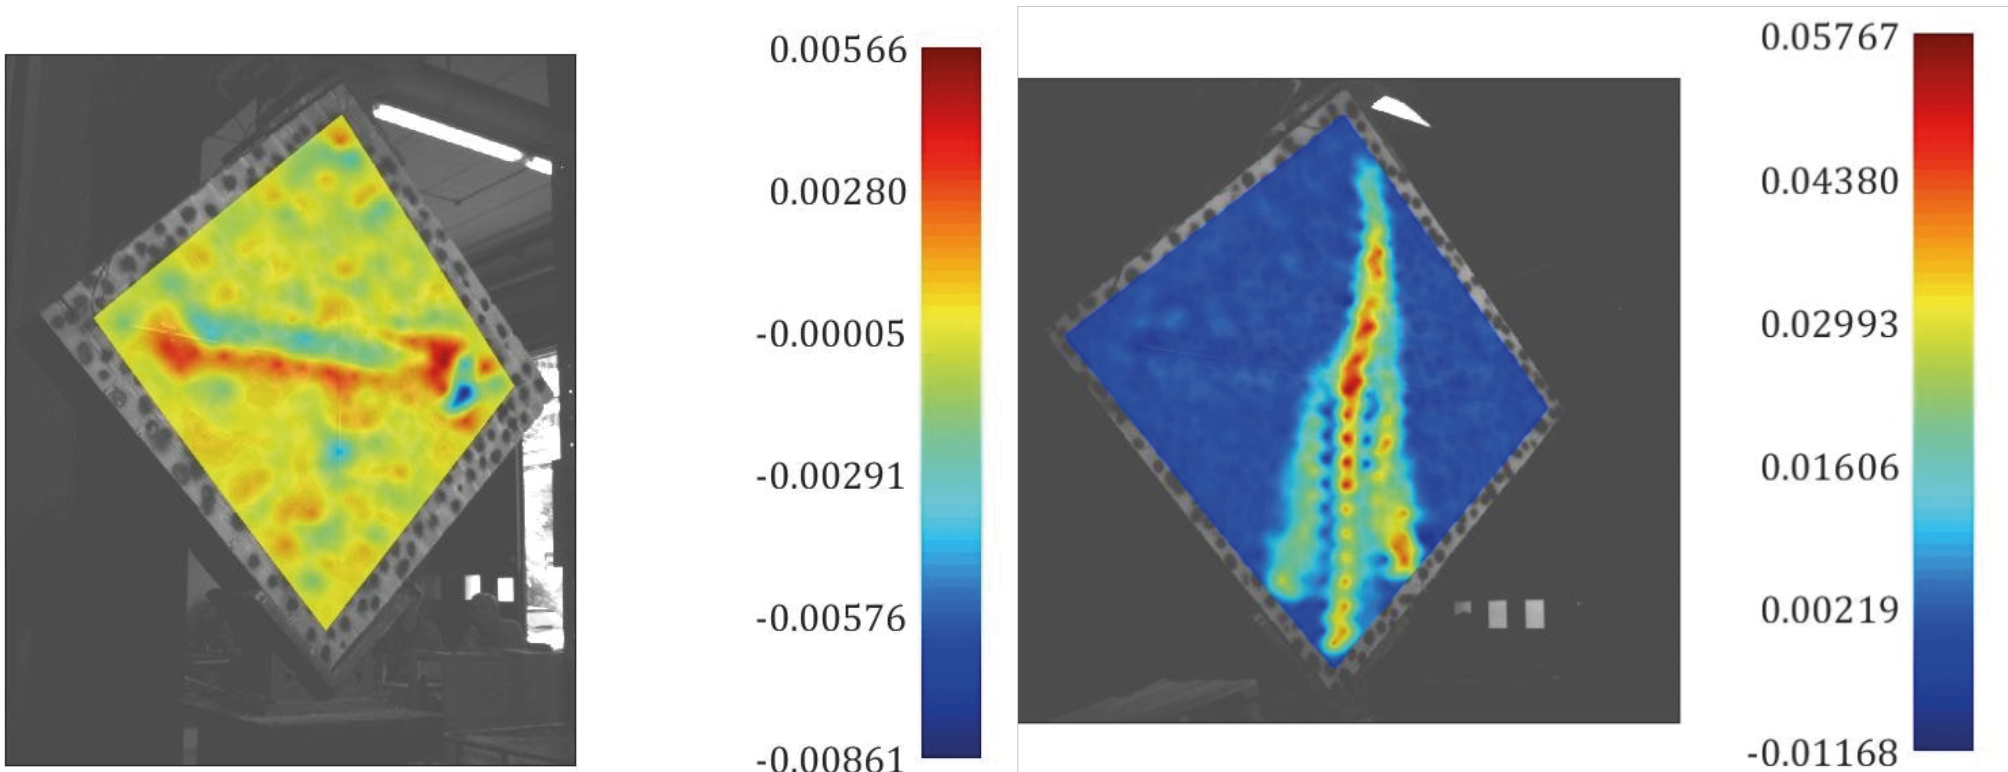
From the 3D node displacements, strain values before collapse were calculated. Fig. 8 shows the maps of the shear strain γ for unreinforced masonry walls (M1) and for strengthened masonry walls (MR2). The strain maps, shear and Von Mises strain, were used to evaluate the evolution of specimen cracking during the test: in the maps of Fig. 8, red concentrations of shear strain indicate the areas where specimens cracked.
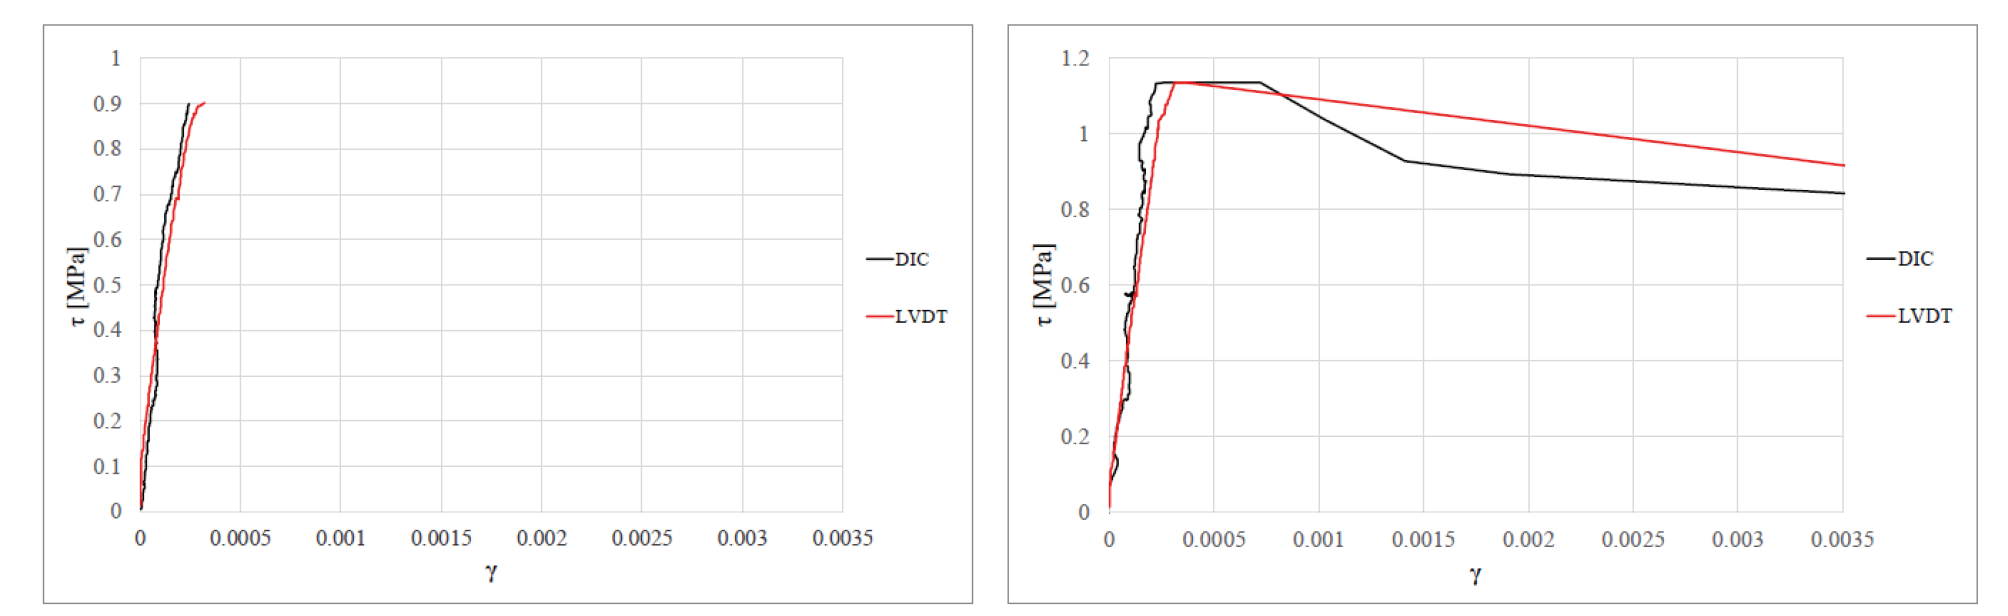
Finally, Fig. 9 shows the τ-γ curve for one unreinforced and one strengthened wall calculated with the values measured with the LVDTs according to the standard ASTM E 519-22 [10] and the curve obtained with the results of the DIC. The DIC shear stress-strain curves showed similar trends to those obtained with LVDT. The shear deformation γ obtained with the DIC was calculated as the average of the values of the whole surface of the wall. The oscillations of the curve obtained with the DIC technique depend on the cameras’ non-optimal positioning. In particular, due to the large support frame, the cameras were placed with too large an angle between the optical axes and a consequent non-optimal illumination. Despite this, a similar trend is obtained in the first part of the two curves, from which the shear modulus G is computed. In particular, the deviations occurring at 0.8 MPa for the strengthened wall depend on the out-of-plane deflection of the wall and the consequent parallax error between the two cameras, due to the presence of the LVDTs.
This issue highlights the need for improved integration of the experimental setup. Future configurations should consider the use of an increased number of cameras (e.g., 4–5) to achieve a more accurate reconstruction of the surface geometry and to reduce occlusions and parallax effects in areas where physical sensors are present. Additional strategies include the adoption of optical markers in place of physical sensors near critical regions and the implementation of pretest alignment and calibration protocols to minimize misalignment errors and enhance system compatibility.
4. Conclusion
This study explores the potential of Digital Image Correlation (DIC) as an advanced and versatile tool for assessing the mechanical behavior of masonry walls during diagonal compression tests. By comparing DIC measurements with those obtained from traditional Linear Variable Differential Transformers (LVDTs), the research highlights the ability of DIC to provide detailed, full-field displacement and strain data. This capability is particularly valuable for capturing complex structural responses, including in-plane and out-of-plane deformations, as well as the evolution of crack patterns and damage mechanisms.
The results demonstrate that the strengthened masonry walls, reinforced with a Textile Reinforced Mortar (TRM) system, exhibit significantly enhanced mechanical performance compared to unreinforced walls. Specifically, the TRM layers improved stiffness, increased peak load capacity, and delayed the crack propagation, leading to a more ductile failure mode. These findings underscore the effectiveness of TRM as a strengthening technique, especially for applications involving historic masonry structures where compatibility, reversibility, and durability are critical considerations.
The study also underscores the unique advantages of DIC over conventional point-based measurement systems. While LVDTs are limited to discrete measurement points, DIC offers a comprehensive view of the deformation behavior across the entire specimen surface. This feature is particularly advantageous in capturing non-uniform deformation patterns, such as localized rotations or out-of-plane displacements, which might otherwise go undetected. Despite some technical challenges, such as suboptimal camera positioning and illumination, the DIC technique provided results that closely aligned with those from LVDTs, particularly in the linear portion of the load-displacement curves.
However, some discrepancies in the later stages of loading were observed, primarily attributed to parallax errors and the influence of LVDT hardware on DIC measurements. Future studies should focus on refining the experimental setup to address these limitations. Improvements in camera alignment, lighting conditions, and the minimization of interference from traditional measurement devices will enhance the accuracy and reliability of DIC data.
Moreover, this research demonstrates the potential for DIC to serve as a complementary or alternative tool to traditional methods in experimental campaigns involving full-scale specimens. By providing high-resolution, three-dimensional data, DIC enables a more nuanced understanding of structural performance, paving the way for improved modeling and analysis techniques. Integrating DIC into experimental workflows can facilitate the development and validation of innovative strengthening solutions, particularly for masonry structures subject to complex loading scenarios.
In conclusion, the findings of this study confirm the utility of DIC as a robust and reliable method for structural assessment. Its ability to capture detailed displacement fields, coupled with its non-invasive and versatile nature, makes it a valuable tool for future research and practical applications. Although the present study was conducted under controlled laboratory conditions, the proposed method shows potential for scalability to on-site applications. However, further investigation is needed to address practical challenges such as lighting, surface texture, and environmental variability. Continued exploration of DIC’s capabilities will further enhance its role in advancing the field of structural engineering, particularly in the development of sustainable and effective reinforcement strategies for existing structures.
5. Acknowledgments
The authors gratefully acknowledge the useful help provided by the technicians Andrea Conti and Franco Rinaldi (Department of Construction, Civil Engineering and Architecture, Università Politecnica delle Marche), during the execution of the experimental tests.
6. Funding
This paper is based on part of the results of the research project “Convezione finalizzata allo studio ed alla caratterizzazione meccanica di sistemi FRCM applicati su murature in mattoni pieni e tufo” (prot. n. 0000389 19/06/2018, UOR:SI000119 – Classif:III/19) financed by Biemme s.r.l., Lucrezia di Cartoceto, Italy
7. Author Contributions
Conceptualization: E.Q., S.L., J.D., G.M.; Funding acquisition: E.Q., S.L., J.D., G.M.; Project Administration: E.Q., J.D., G.M.; Investigation: G.C., G.M., J.D.; Methodology: G.C., G.M., J.D., E.Q.; Validation: G.M., G.C., J.D., E.Q., S.L., V.C., F.M.; Visualization, Writing and Editing, G.M., G.C., J.D., F.M.
8. References
[1] Clementi F, Quagliarini E, Monni F, Giordano E, Lenci S (2017) Cultural Heritage and Earthquake: The Case Study of ‘Santa Maria Della Carità’ in Ascoli Piceno. Open Civ Eng J 11:1079–1105. https://doi.org/10.2174/1874149501711011079
[2] Schiavoni M, Giordano E, Roscini F, Clementi F (2023) Advanced numerical insights for an effective seismic assessment of historical masonry aggregates. Eng Struct 285:115997. https://doi.org/10.1016/j.engstruct.2023.115997
[3] Salachoris GP, Standoli G, Betti M, Milani G, Clementi F (2023) Evolutionary numerical model for cultural heritage structures via genetic algorithms: a case study in central Italy. Bull Earthq Eng. https://doi.org/10.1007/s10518-023-01615-z
[4] Thamboo J, Zahra T, Asad M, Silva L, Gimhani J (2022) Analytical model for CFRP confined masonry columns subjected to monotonic and cyclic compression. Compos Struct 292:115696. https://doi.org/10.1016/j.compstruct.2022.115696
[5] Jing J, Zhou C, Lin C (2023) Compressive behavior of brick masonry columns confined with composites embedded in the horizontal mortar joint. Structures 57:105120. https://doi.org/10.1016/j.istruc.2023.105120
[6] Wang J, Wan C, Shen L, Zeng Q, Ji X (2023) Compressive behavior of masonry columns confined with basalt textile-reinforced concrete. J Build Eng 75:107019. https://doi.org/10.1016/j.jobe.2023.107019
[7] Quagliarini E, Monni F, Greco F, Lenci S (2017) Flexible repointing of historical facing masonry column-type specimens with basalt fibers: A first insight. J Cult Herit 24:165–170. https://doi.org/10.1016/j.culher.2016.11.003
[8] Keshmiry A, Hassani S, Dackermann U, Li J (2024) Assessment, repair, and retrofitting of masonry structures: A comprehensive review. Constr Build Mater 442:137380. https://doi.org/10.1016/j.conbuildmat.2024.137380
[9] Kouris LAS, Triantafillou TC (2018) State-of-the-art on strengthening of masonry structures with textile reinforced mortar (TRM). Constr Build Mater 188:1221–1233. https://doi.org/10.1016/j.conbuildmat.2018.08.039
[10] ASTM (2022) Standard Test Method for Diagonal Tension (Shear) in Masonry Assemblages. ASTM E519-22. https://doi.org/10.1520/E0519
[11] Callaway P, Gilbert M, Smith CC (2012) Influence of backfill on the capacity of masonry arch bridges. Proc Inst Civ Eng Bridg Eng 165:147–157. https://doi.org/10.1680/bren.11.00038
[12] De Canio G, de Felice G, De Santis S, Giocoli A, Mongelli M, Paolacci F, Roselli I (2016) Passive 3D motion optical data in shaking table tests of a SRG-reinforced masonry wall. Earthquakes and Structures 10(1):53–71. https://doi.org/10.12989/EAS.2016.10.1.053
[13] Schreier H, Orteu J-J, Sutton MA (2009) Image Correlation for Shape, Motion and Deformation Measurements. Springer US, Boston, MA
[14] McCormick N, Lord J (2010) Digital Image Correlation. Mater Today 13:52–54. https://doi.org/10.1016/S1369-7021(10)70235-2
[15] Badaloni M, Rossi M, Chiappini G, Lava P, Debruyne D (2015) Impact of Experimental Uncertainties on the Identification of Mechanical Material Properties using DIC. Exp Mech 55:1411–1426. https://doi.org/10.1007/s11340-015-0039-8
[16] Chiappini G, Sasso M, Bellezze T, Amodio D (2018) Thermo-structural analysis of components in ceramic material. Procedia Struct Integr 8:618–627. https://doi.org/10.1016/j.prostr.2017.12.061
[17] Stazi F, Tittarelli F, Saltarelli F, Chiappini G, Morini A, Cerri G, Lenci S (2018) Carbon nanofibers in polyurethane foams: Experimental evaluation of thermo-hygrometric and mechanical performance. Polymer Testing 67:234–245. https://doi.org/10.1016/j.polymertesting.2018.01.028
[18] Sasso M, Mancini E, Chiappini G, Sarasini F, Tirillò J (2018) Application of DIC to Static and Dynamic Testing of Agglomerated Cork Material. Exp Mech 58:1017–1033. https://doi.org/10.1007/s11340-017-0369-9
[19] Donnini J, Chiappini G, Lancioni G, Corinaldesi V (2019) Tensile behaviour of glass FRCM systems with fabrics’ overlap: Experimental results and numerical modeling. Compos Struct 212:398–411. https://doi.org/10.1016/j.compstruct.2019.01.053
[20] Pan B, Qian K, Xie H, Asundi A (2009) Two-dimensional digital image correlation for inplane displacement and strain measurement: a review. Meas Sci Technol 20:062001. https://doi.org/10.1088/0957-0233/20/6/062001
[21] Ozdemir A, Sangirardi M, Judd M, Acikgoz S (2025) Evaluation of test procedures and correlations for the mechanical characterisation of brick masonry and its constituents. Constr Build Mater 489:142133. https://doi.org/10.1016/j.conbuildmat.2025.142133
[22] Bello I, Martínez-Abella F, Wardeh G, González-Fonteboa B (2024) Complete stress-strain analysis of masonry prisms under compressive loading-unloading cycles through digital image correlation. Eng Struct 298:117088. https://doi.org/10.1016/j.engstruct.2023.117088
[23] Bilotta A, Ceroni F, Lignola GP, Prota A (2017) Use of DIC technique for investigating the behaviour of FRCM materials for strengthening masonry elements. Compos Part B Eng 129:251–270. https://doi.org/10.1016/j.compositesb.2017.05.075
[24] Donnini J, Lancioni G, Corinaldesi V (2018) Failure modes in FRCM systems with dry and pre-impregnated carbon yarns: Experiments and modeling. Compos Part B Eng 140:57–67. https://doi.org/10.1016/j.compositesb.2017.12.024
[25] Donnini J, Spagnuolo S, Corinaldesi V (2019) A comparison between the use of FRP, FRCM and HPM for concrete confinement. Compos Part B Eng 160:586–594. https://doi.org/10.1016/j.compositesb.2018.12.111
[26] Giordano E, Masciotta MG, Clementi F, Ghiassi B (2023) Numerical prediction of the mechanical behavior of TRM composites and TRM-strengthened masonry panels. Constr Build Mater 397:132376. https://doi.org/10.1016/j.conbuildmat.2023.132376
[27] Gattesco N, Boem I (2017) Out-of-plane behavior of reinforced masonry walls: Experimental and numerical study. Compos Part B Eng 128:39–52. https://doi.org/10.1016/j.compositesb.2017.07.006
[28] UNI (2019) Methods of test for mortar for masonry — Part 11: Determination of flexural and compressive strength of hardened mortar. EN 1015-11:2019. Ente Nazionale Italiano di Unificazione, Milan
[29] EN 12504-4:2021 (2021) Testing concrete in structures - Part 4: Determination of ultrasonic pulse velocity.
[30] Quagliarini E, Lenci S, Iorio M (2010) Mechanical properties of adobe walls in a Roman Republican domus at Suasa. J Cult Herit 11:130–137. https://doi.org/10.1016/j.culher.2009.01.006
[31] Quagliarini E, Lenci S, Piattoni Q, Bondioli F, Bernabei I, Lepore G, Zaccaria M (2014) Experimental Analysis of Romanesque Masonries Made by Tile and Brick Fragments Found at the Archaeological Site of S. Maria in Portuno. International Journal of Architectural Heritage 8(2):161–184. https://doi.org/10.1080/15583058.2012.683132
[32] Quagliarini E, Maracchini G (2018) Experimental and FEM Investigation of Cob Walls under Compression. Adv Civ Eng 2018:21–29. https://doi.org/10.1155/2018/7027432
[33] Amodio D, Broggiato GB, Campana F, Newaz GM (2003) Digital speckle correlation for strain measurement by image analysis. Exp Mech 43:396–402. https://doi.org/10.1177/0014485103434004