https://doi.org/10.36253/rea-16859
Received: November 11, 2025; Revised: January 23, 2026; Accepted: February 20, 2026
Research article
Using the Analytic Hierarchy Process to prioritise criteria to enhance AquaCrop from the user perspective
1 University of Rome, Department of Architecture and Design, Landscape and Environment Sapienza, Italy
2 CREA – Council for Agricultural Research and Economics - Policies and Bioeconomy, Italy
3 University of Florence, Department of Agriculture, Food, Environment and Forestry, Italy
4 CREA - Council for Agricultural Research and Economics - Agriculture and Environment, Italy
5 University of Naples, Department of Engineering, Italy
*Corresponding author. E-mail: itzelinti.donati@uniroma1.it
Abstract. The successful advancement of precision agriculture depends on the availability of agrometeorological and agroclimatic data with high spatiotemporal resolution. However, such data must also be high quality, consistent, and nationally valid, allowing for long-term model calibration and short-term decision support systems. This study explores potential improvements to AquaCrop, a widely used crop water productivity model developed by the Food and Agriculture Organization, by incorporating feedback from interviewees to enhance its applicability and to promote more sustainable water resource use. Interviewees (farmers, researchers, and information technology experts) were surveyed using structured questionnaires, and responses were analysed through the Analytic Hierarchy Process (AHP) using the Super Decisions software. A three-level hierarchical model was developed to assess and prioritise desirable model features. The results demonstrate that the AHP effectively captures user needs and identifies concrete areas for model improvement. Notably, the criterion related to data management (C3) emerged as a key priority, particularly the capability for automatic communication with external Internet of Things platforms. This study emphasises the importance of involving both users (farmers and researchers) and information technology experts in evaluating the technical feasibility of proposed upgrades. The significant preference weights expressed by farmers (0.15) and researchers (0.18) further underscore the importance of aligning model development with real-world operational needs.
Keywords: decision making process, strategic planning, irrigation, crop production models, water management.
JEL codes: Q25, Q54, Q55.
Contents
2. The role of AquaCrop in policy development
Highlights
- –This study is organised into five sections to ensure rigorous implementation of the Analytic Hierarchy Process for the assessment and enhancement of the AquaCrop model.
- –User-centred model improvement: this study highlights the importance of user feedback in improving AquaCrop, a widely used crop water productivity model.
- –Collaborative approach to software development: collaboration between users, information technology experts and professionals with deep knowledge of software modelling underlines a holistic approach to software development.
1. Introduction
Crop production simulation models simulate the growth and development of a given crop and estimate its production capacity under different environmental and agronomic conditions. Since the 1990s, these models have become increasingly common in the research sector as well as in agronomic studies (Giardini, 2012). Currently, there are various crop models with different levels of detail, scale, and representativeness, including DSSAT, WOFOST, EPIC, CropSyst, and STICS (Rauff, Bello, 2015; Kasampalis et al., 2018; Chapagain et al., 2022; Garofalo et al., 2025). Among these crop growth simulation models, AquaCrop focuses on water productivity and can be used: (i) to plan irrigation strategies to improve water use and productivity in agricultural production; (ii) to address increasing competition for scarce freshwater resources by optimising consumption; and (iii) to increase profitability by improving the ability of farmers to use water more productively, especially in situations of water scarcity. AquaCrop was launched by the Land and Water Division of the Food and Agriculture Organization (FAO) in 2009 (Steduto et al., 2009). This highly accurate and simple to use model incorporates simulations of crop responses – including yield, biomass accumulation, and water productivity – under different water availability scenarios. These attributes have contributed to its broad acceptance among both researchers and practitioners, who employ it as a decision support tool for the formulation and implementation of efficient water management strategies in routine agricultural practice (Roja et al., 2023). Although there are many advantages to using the AquaCrop model, there are also disadvantages. Indeed, AquaCrop comes as pre-compiled software with an intuitive user interface, but this structure limits customisation, preventing users from directly intervening in the code to adapt the model to specific needs (Vanuytrecht et al., 2014; Foster et al., 2017).
Recent research in crop growth modelling has focused mainly on the calibration steps, defined as the standard practice of estimating crop parameters based on field observations (Seidel et al., 2018; Ahmed, 2020; Winn et al., 2023). Substantial efforts have also been made to collect useful data on different environmental conditions and crop management practices(Steduto et al., 2009). The primary objective of this study is to investigate and enhance the usability of the AquaCrop model, with particular emphasis on its capacity to simulate crop growth and water productivity. To achieve this objective, it was essential to identify potential areas for improvement in the model through a comprehensive analysis of the feedback and preferences provided by researchers, farmers (end-users), and information technology (IT) developers (technical experts).
As highlighted by many studies in the field of soil and water assessment (AbdelRahman et al., 2025; Ali et al., 2025), decision support services in agriculture increasingly rely on multicriteria analysis tools, particularly for identifying and prioritising the spatial data required to develop effective agricultural policies. These approaches enable the management of the inherent complexity of agro-environmental systems by integrating physical, climatic, socio-economic, and land management variables into a coherent and structured decision-making framework. Despite these advances, a methodological gap remains regarding the ability of decision support models to fully address the needs of stakeholders who rely on these tools. Specifically, the literature highlights a lack of alignment between the prioritisation of spatial and environmental data and the operational and strategic requirements of decision-makers in the agricultural sector.
This study contributes to the existing literature through the application of the Analytic Hierarchy Process (AHP) in three ways. First, the results of this study can serve as a suggestion to the various stakeholders, managers and private sector involved in planning crop growth models. Second, the detailed analysis of the barriers identified by the users in the implementation of AquaCrop carried out here contributes to fill the existing gap in the literature and to help the academicians/researchers working in this field. Finally, this study identifies the preferences related to the use of the model and ranks them according to their degree of relevance. The AHP is employed to structure and clarify the relationships and relative importance among key factors influencing the improvement of decision support tools in precision agriculture, as exemplified by the AquaCrop model. Given that the successful advancement of precision agriculture relies heavily on high-quality, consistent, and high-resolution agrometeorological and agroclimatic data, it is essential to systematically evaluate both technical and user-oriented requirements.
This paper is divided into five sections. Section 1 provides the introduction and general overview of crop simulation models. Section 2 presents the key features of AquaCrop and its relevance to policy development. Section 3 outlines the research methodology used to prioritise criteria and sub-criteria. Section 4 discusses data analysis and results. Finally, Section 5 concludes the paper with theoretical and practical implications, as well as the limitations of this study.
2. The role of AquaCrop in policy development
To clarify the policy implications of this study, it is appropriate to specify which aspects of the new Common Agricultural Policy (CAP) of the European Union this paper aims to support. As described by Knierim, Birke (2023), the CAP for 2023-2027 enhances a key element, the concept of Agricultural Knowledge and Innovation System (AKIS), which refers to the cooperation of actors from extension, research, professional organisations, and other stakeholders in the sector (Labarthe, European Seminar on Extension & Education (26 : 2023 : Toulouse), 2023; Sutherland et al., 2023). Knowledge, innovation, and technical education, including the provision of services to farmers, represents a transversal goal, together with the objective of simpler, more transparent, and effective policy (De Castro et al., 2020). As Van Oost, Vagnozzi (2020) point out, AKIS is a rather complex bundle where research and innovation link with practice and connect with farmers and other operators through the support of farmers’ organisations, advisors, private companies, education systems, digital tools, and data and knowledge sharing. Synergies are expected to develop among the different components involved in AKIS, with the ultimate goal of providing the agricultural business system more tools for sustainable economic development (Proietti, Cristiano, 2023; Sutherland et al., 2023). Building on this framework, the goal of this study is reinforced by its focus on providing timely and relevant information to support innovation processes. In particular, it underscores the role of agricultural extension services as essential knowledge providers, with AquaCrop serving as a practical example of how decision support tools can enhance service delivery. To reflect the AKIS approach, this study involves three categories of interviewees: researchers, farmers (users), and IT developers (experts).
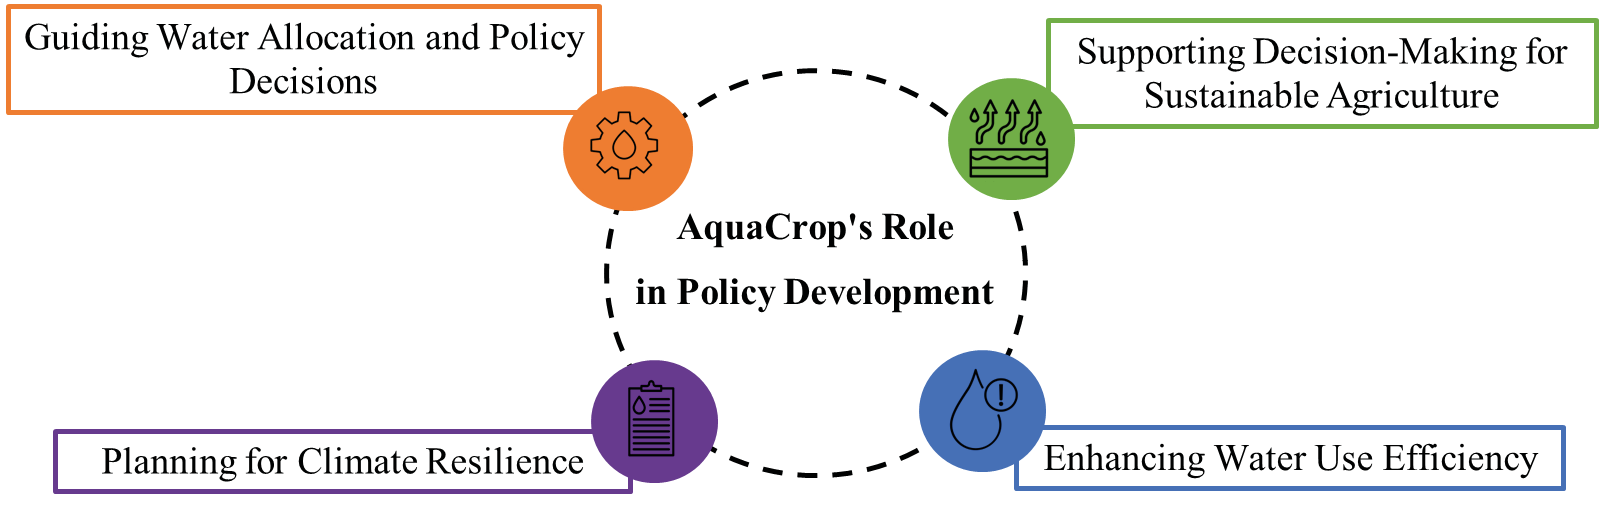
AquaCrop is a strategic decision support tool for agricultural and environmental policies addressing water scarcity and climate change. By supporting efficient water allocation, climate adaptation, and sustainable crop management, this model provides policymakers with robust evidence to design resilient and resource-efficient agricultural systems (Figure 1) (García-Vila et al., 2009; Heng et al., 2009; Raes et al., 2009; Steduto et al., 2009; Altobelli, Henke, 2024).
3. Research methodology
This study was conducted in three sequential phases, as illustrated in Figure 2. Phase I involved selection of criteria and sub-criteria through a general survey to establish the hierarchical structure of the AHP. This preparatory phase had three main objectives: (i) to conceptualise research objectives, (ii) to define AHP criteria and sub-criteria, and (iii) to determine the format of the questions. Phase II comprised the selection and invitation of experts. During four international meetings, experts in agricultural forecasting models presented and discussed their results. Researchers and professors met to discuss future challenges in the sector. By participating in these conferences, frameworks, and meetings, which will be presented later, the authors of this work were able to discuss with respondents from the academic and the research community. Finally, Phase III involved calculation of the weight of each criterion and sub-criterion, by applying the AHP.
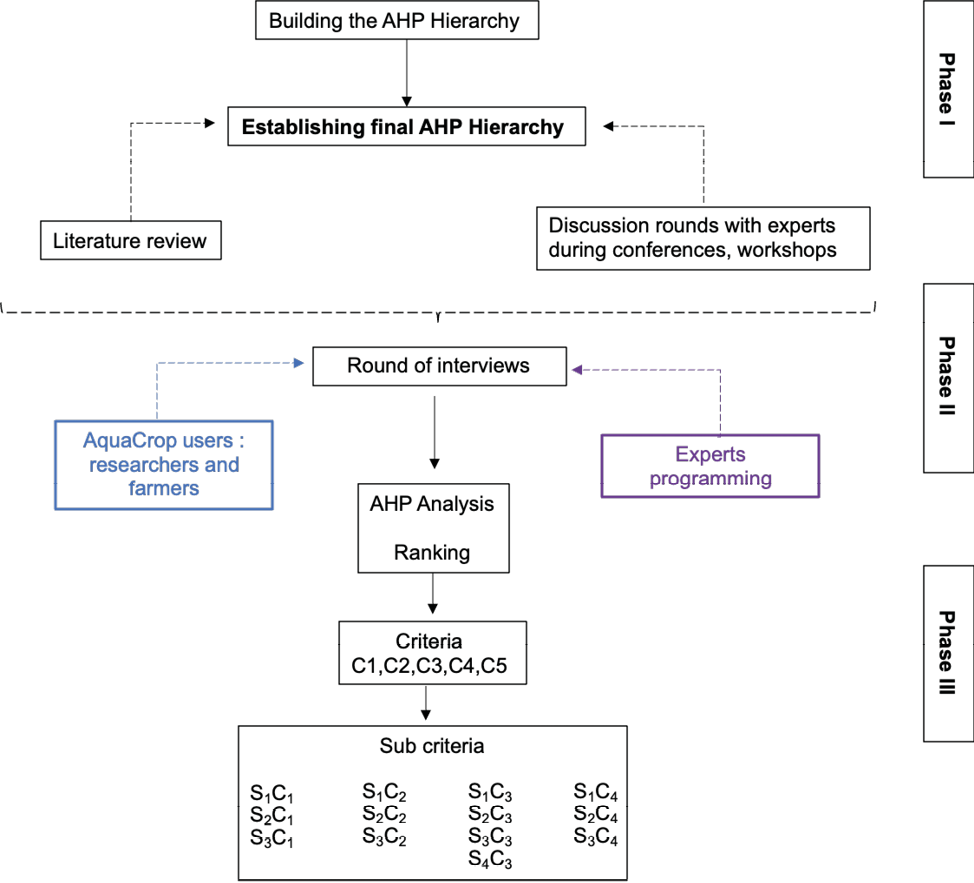
According to the literature, to guarantee that the AHP analysis is consistent, it is necessary to ensure proper structuring of the hierarchy and selection of the criteria and sub criteria that are most appropriate to the goal of the hierarchy (Saaty, Vargas, 2012). Phase I was crucial to ensure inappropriate criteria were not selected.
As documented in the literature, the AHP does not require large sample sizes to produce reliable and meaningful results, as it is based on structured pairwise comparisons rather than statistical inference. The robustness of AHP outcomes depends primarily on the expertise of the respondents and the internal consistency of their judgments, rather than on the number of participants involved. Several studies have shown that small panels of well-selected experts are sufficient, and often preferable, when the objective is to elicit informed preferences and priorities in complex decision-making contexts(Cay, Uyan, 2013; Elolu et al., 2025). In this study, the authors decided to involve 10 participants for the stakeholder group to ensure a balance between diversity of perspectives and high consistency of pairwise comparisons, which was confirmed by a consistency ratio below the accepted threshold (< 0.1) for all matrices. This approach is consistent with previous AHP applications in agriculture and natural resource management, where expert samples of similar size have been successfully employed.
3.1. Application of the AHP
The AHP is a method of multi-criteria decision analysis developed by Thomas Saaty in the late 1970s. One of the fundamental determinants to ensure the AHP is used effectively – so that decisions are made under conditions of multi-criteria certainty– is that the decision-maker must have complete information about the decision environment and the consequences of the decision alternatives. The AHP also includes steps for measuring the consistency of judgments called the consistency ratio. A value of 0 means that there is perfect consistency, a value < 0.1 ensures that the judgments are consistent and reliable, and values > 0.1 indicate inconsistency (Benítez et al., 2012; Lane, Verdini, 2007). There are two main sources of inconsistency: the method of structuring the model and criteria considered, and the questionnaire administration method. There is extensive published information on the mathematical foundations of the AHP (Saaty, Ozdemir, 2003; Ishizaka, Lusti, 2006; Ishizaka, Labib, 2009, 2011; Ishizaka et al., 2011, 2012). Therefore, this section provides a brief overview of the steps taken to obtain the weights needed to determine the AquaCrop improvement scenario.
Close collaboration within a well-connected research network significantly accelerated the development of the hierarchical structure of the AHP analysis, enabling rapid consultation with most experts and achieving a high response rate. However, as suggested by (Beiderbeck et al., 2021), research teams should be aware of potential biases and homogeneous thinking within a narrow network. Thus, interaction with experts took place over several rounds during the year and in different contexts. Several researchers were invited to comment on the criteria and subjectivities identified in the next steps of the analysis. In particular, they were first invited to share their experiences of using crop growth models through open-ended questions, focusing on the use of AquaCrop when requested. The first objective of the formulation sessions was not to define the final set of statements that would be required in the second step of the AHP, but rather to collect related information, and to choose the AHP interview format and key questions that led to the definition of the criteria and sub-criteria. The main scientific initiatives that drove the development of this phase of the work are briefly outlined below and summarised in Table 1.
| Key events used to construct the hierarchical structure of the AHP and to select participants | |
|---|---|
| The Global Framework on Water Scarcity in Agriculture (WASAG) | To develop the research question for this study, the authors consulted experts at the 2nd International Forum on Water Scarcity in Agriculture ‘Making Agriculture Resilient to Climate Change: Water Scarcity’. The Forum aimed to share relevant knowledge and information on key issues; to network and foster collaboration among partners; and to showcase the latest technologies, practices, and products in agriculture. WASAG brings together key players from all over the world and from different sectors. This partnership is hosted by the FAO and consists of government agencies, international organisations, research institutions, stakeholders, and professional associations to develop and implement policies, strategies and programmes to adapt agriculture to water scarcity on the ground. |
| Innovation for Drought and Agriculture (FAO – IRI) | Innovation in drought management and agriculture were the key topics discussed during the session. Experts presented participatory and innovative tools, methods, and approaches essential for effective drought management in agriculture. Additionally, they showcased research activities related to the application of agronomic models. |
| Conference on micrometeorological measurements – Urban microclimate monitoring and agricultural meteorology for climate change (FAIRNESS) | The debate was developed around the exchange of experiences and projects presented by international research centres and universities with the aim of improving the standardisation and integration between databases/sets of micrometeorological measurements, including crop growth prediction models. On this occasion, it was possible to review publications and research activities related to the use of AquaCrop in complex climatic-environment contexts. |
| The Global Symposium on Soils and Water (GSOWA23) | On this occasion, the most relevant aspects for this manuscript were the technical sessions related to soil and water management, applications of data remote sensing innovations, database for monitoring evapotranspiration, topics on which the functioning of the AquaCrop model is also based. |
To identify an appropriate structure on which to base the hierarchical structure of the AHP content, the criteria and sub-criteria were selected through a literature review, expert interviews, brainstorming, and group discussions among researchers. In addition, there was extensive consultation with software programmers. Four rounds of expert consultation were conducted through face-to-face brainstorming. This was a fundamental step in collecting the responses, which were then categorised into preferences. Three types of experts, two of them users, were consulted.
- –Farmers: the sample consisted of 10 farmers selected from the AquaCrop section workshops. The FAO has published a list spanning from July 2009 to July 2020 (https://www.fao.org/aquacrop/workshops/archive/en/#c668638 accessed on 23 August 2025) of the initiatives it has organised to disseminate knowledge and use of the software among interested parties. International and local partners are involved to train participants in the practical applications of AquaCrop, including strategic management to increase crop water productivity. After completing these courses, participants can train other users in their countries.
- –Researchers: a total of 10 researchers were contacted. After each interview, members of the research team reviewed the results to ensure the consistency of the AHP pairwise comparison matrix.
- –IT experts: one interview session involved 10 computer scientists. Their expertise in software selection and programming was fundamental to this study. The main objective of the survey was to evaluate the ease of integration of the operations, proposed to the users (researchers and farmers) of the AquaCrop model.
While constructing the hierarchy, the environment surrounding the goal was considered with sufficient relevant detail to fully represent the problem. Assessing the issues and attributes that influence the solution, identifying the stakeholders involved, and incorporating user perspectives in the improvement of AquaCrop constituted the main steps in constructing the hierarchical model. As suggested by Saaty (2004), organising goals, attributes, issues, and actors into a hierarchy serves three primary purposes: it provides a holistic view of the problem, enables decision-makers to compare elements of similar weight or impact, and captures the distribution of influence from the most significant criteria to the least significant. There are several types of hierarchies depending on the arrangement of goals, attributes, and stakeholders in the analysis (Forman, 1993). Hierarchies can be structured as forward or backward planning. This study used a forward planning hierarchy, descending from the main objective to criteria and sub-criteria. It incorporated exploratory scenarios based on stakeholders’ weighted judgments, which guided the optimisation of the AquaCrop model and are discussed in the results section. In this study, questionnaires were distributed to AquaCrop users to achieve the objective outlined above. The AHP was used here solely to assess the relative importance of criteria and sub-criteria, in line with Saaty’s approach (Saaty, 1987, 2008). Unlike traditional AHP applications that involve comparing alternatives, this study focused exclusively on structuring and prioritising the criteria and sub-criteria, a methodology also adopted by De Felice, Petrillo (2013).
To improve the performance of the AquaCrop model, a three-level hierarchical network was developed for the selection of features and functions (Figure 3). The first level – focus – has a single objective: to improve the use of AquaCrop to best meet user needs. The second level consists of four criteria (C1-C4) that specify the content and meaning of the focus. The criteria are compared in pairs to determine the criterion with the most relevant weight based on the participants’ answers. The third level corresponds to the sub-criteria, which represent the functionalities with the materialised criteria. The relative priorities between the sub-criteria are also established through pairwise comparisons, as for the second level. The criteria and sub-criteria are summarised in Table 2.
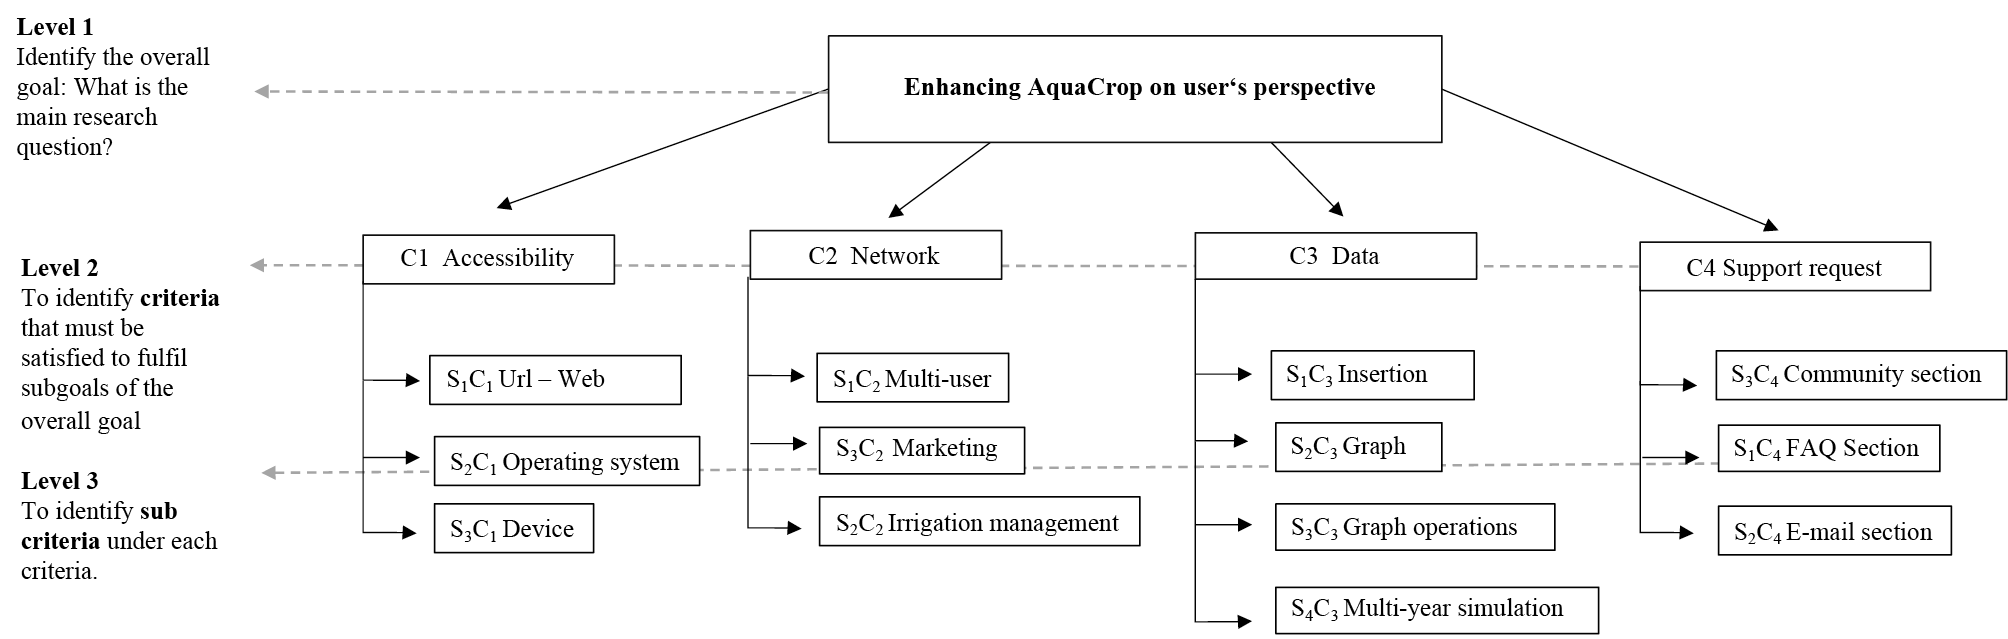
| Criterion | Description | Sub-criterion | Description |
|---|---|---|---|
| C1 | Accessibility | S1C1 | URL – Web: the end user will not be required to install any software on their PC in order to access the service |
| S2C1 | Operating system compatibility: installing a model compatible with iOS and Windows on the user’s computer | ||
| S3C1 | Devices: implementation of a user interface that facilitates simplified access from smartphones and tablets, such as an app | ||
| C2 | Network | S1C2 | Multi-user: enables multiple operators to access the same data at the same time |
| S2C2 | Irrigation management: sharing information related to the irrigation management conducted by the company with the assistance of AquaCrop | ||
| S3C2 | Marketing: a consultation-only section is proposed for AquaCrop company projects in order to communicate externally the value of sustainable water use achieved | ||
| C3 | Data | S1C3 | Input: reduction of the amount of data that the user must enter into the model (for crop calibration, irrigation management, and soil characteristics). It is possible to configure the system to communicate automatically with an external Internet of Things platform. |
| S2C3 | Graph: the user can obtain at the end of the crop cycle the final production and the total irrigation volume | ||
| S3C3 | Graph operations: it will be possible to carry out five different operations on one graph | ||
| S4C3 | Multi-year simulation: the creation of graphs that can be used to compare different agricultural years and irrigation scenarios | ||
| C4 | Support request | S1C4 | Frequently asked questions (FAQs): developing a list of questions and answers prepared on the most common problems encountered when using the model, which can be accessed by clicking on the icon |
| S2C4 | Email section: reports from users of answers that are not available in FAQs are collected through email support | ||
| S3C4 | Community section: a website equipped with a platform function that allows users to ask and answer questions through registration and active participation. |
4. Results and discussion
The AHP was applied to identify and prioritise criteria for improving the usability of the AquaCrop model, to better meet the needs of users. The analysis incorporated judgments from 30 participants, including 20 end users (farmers and researchers) and 10 IT experts. The results are based on pairwise comparisons conducted across all defined criteria and sub-criteria.
Beyond eliciting user preferences, IT experts assessed the operability and technical feasibility of the criteria and sub-criteria identified by users. The resulting hierarchy, referred to as the ‘classification of criteria operability’, shows a high degree of consistency with the user-derived hierarchies. This alignment indicates that the most critical user requirements are largely achievable from a technical perspective, strengthening the validity of the prioritisation results and supporting their use as a decision-making framework for future AquaCrop development. From a broader perspective, this consistency highlights the central role of AquaCrop as a reference crop model for irrigation planning and assessment of water productivity. The wide adoption of the AquaCrop model in research and operational contexts makes usability, accessibility, and data management key conditions to maximise its impact as a decision support tool.
The results of the questionnaires were analysed using Excel and the open-source software package Super Decisions (https://www.superdecisions.com/, accessed on 20 October 2023). The priority weights of all criteria and sub-criteria were calculated and then combined in each matrix to obtain a global priority vector. Based on the previous experience (Donati et al., 2023), the authors decided to split the sample by dividing the stakeholder group into users (farmers and researchers) and programming experts. In addition, they decided that instead of using a postal survey, they would meet with experts to explain the importance of pairwise comparisons in multi-criteria AHP analysis and to ensure that the participants were fully aware and understood the criteria they had to compare. This procedure reduced the possibility of inconsistent production between the elements of the pairwise comparison matrix (indicating a degree of randomness in the participants’ answers). The consistency ratios for the matrices were < 0.1, indicating consistency in the judgements.
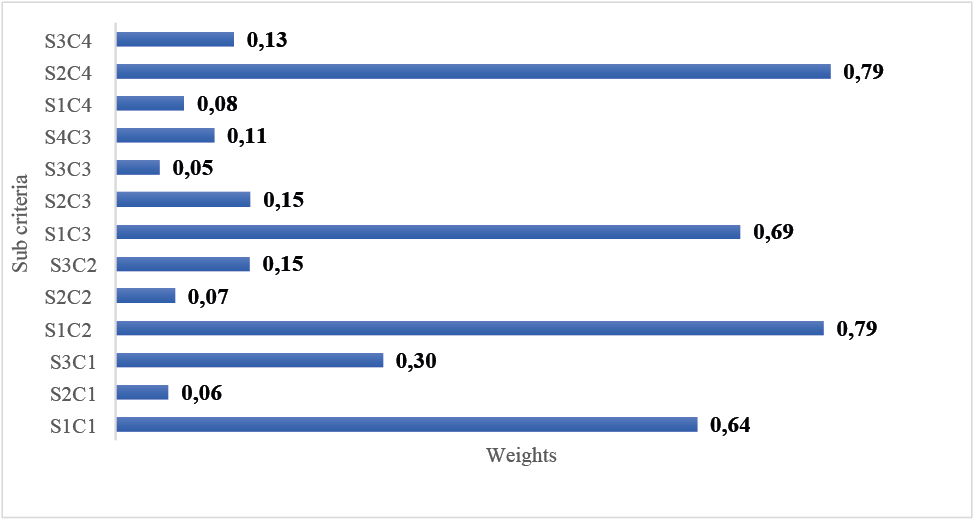
For the farmers, the weights ranged from 0.05 for criterion C4 (support request) to 0.72 for criterion C1 (accessibility) (Table 3). According to the farmers (Figure A.1) from the sub-criteria analysis, sub-criteria S1C3 had a priority value of 0.69: to improve the use of AquaCrop, it is necessary to reduce the amount of data that the user must enter into the model (for crop calibration, irrigation management, and soil characteristics). This outcome clearly reflects the dual nature of AquaCrop: on the one hand, its strength lies in process-based simulation of crop-water relationships; on the other hand, its practical adoption is strongly conditioned by the availability, quality, and complexity of required inputs. The high priority attributed to data simplification confirms that enhancing usability is crucial to fully exploit AquaCrop’s robustness beyond expert-driven research applications. Sub-criteria S1C2 and S2C4 each had a priority value of 0.79. This result is consistent with recent AquaCrop-based applications where simplified parameterisation strategies and predefined datasets proved essential to broaden model adoption and to support on-farm irrigation decisions while preserving simulation reliability (Garofalo et al., 2025).
| Goal | Criterion | Weight of the criterion | Final ranking |
|---|---|---|---|
| Enhance the use of AquaCrop to best meet user needs | C1 – accessibility | 0.72 | 1 |
| C2 – network | 0.15 | 2 | |
| C3 – data | 0.07 | 3 | |
| C4 – support request | 0.05 | 4 |
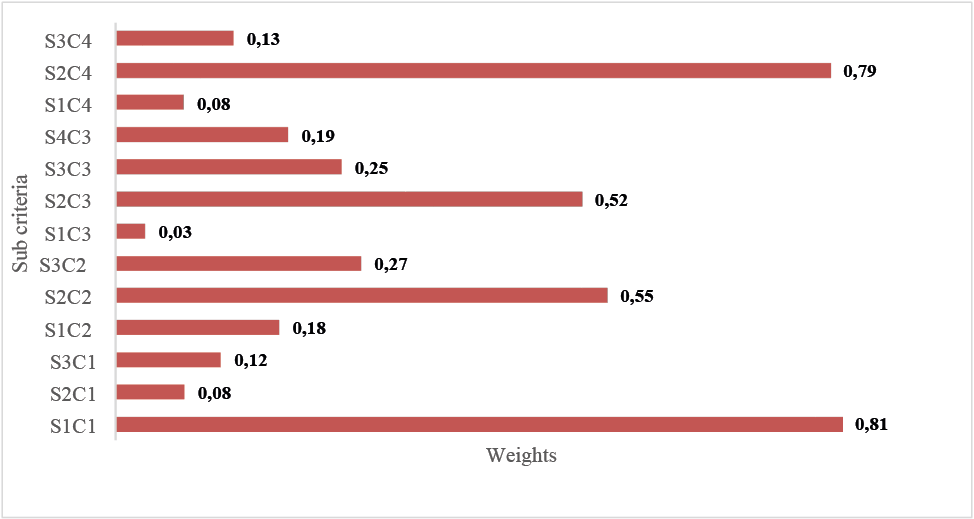
Table 4 shows the weightings for the researchers. According to them, criterion C2 is not as relevant as criterion C1. In general, the farmers’ and researchers’ were similar, but with a clear difference in the weighting between the most and least important criteria. Nevertheless, data and accessibility are very important for the implementation of the AquaCrop model for both farmers and researchers. On the other hand, the most important sub-criteria are user reports of answers not available in FAQs, collected through email support. At this level of the hierarchy (level 2), there is some difference between the judgements expressed by farmers and researchers. Researchers expressed greater preference for sub-criteria S1C2 (0.55) and S2C3 (0.52) (Figure A.2). These preferences emphasise the role of AquaCrop as a shared analytical platform, where simulation results are not only generated but also interpreted, compared, and communicated among multiple groups of users. This dimension becomes particularly relevant when AquaCrop outputs are used within integrated evaluation frameworks to assess alternative management strategies.
| Goal | Criterion | Weight of the criterion | Final ranking |
|---|---|---|---|
| Enhance the use of AquaCrop to best meet user needs | C1 – accessibility | 0.69 | 1 |
| C2 – network | 0.09 | 3 | |
| C3 – data | 0.18 | 2 | |
| C4 – support request | 0.04 | 4 |
In this regard, recent multi-objective approaches demonstrated that AquaCrop simulations gain operational value when coupled with decision support layers that can synthesise outputs across objectives and facilitate comparison among scenarios, reinforcing the importance of visualisation tools and collaborative access (Garofalo, Vonella, 2025).
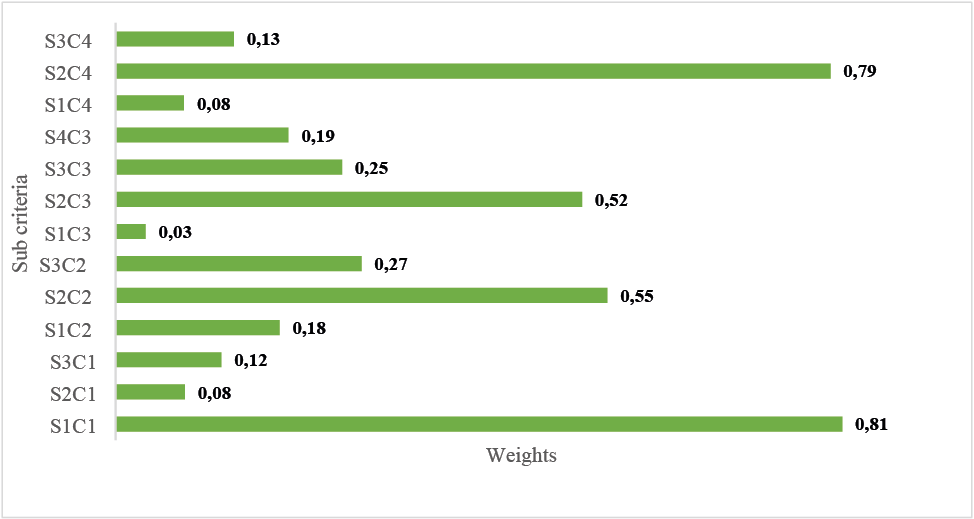
As shown in Table 5, among the IT experts, the highest weight was given to criterion C1, followed by criterion C3. Criterion C4 was given the least importance. The most important sub-criteria for this group are S1C1 (0.81), S1C2 (0.52), S2C4 (0.79) (Figure A.3).
| Goal | Criterion | Weight of the criterion | Final ranking |
|---|---|---|---|
| Classify the operability of the criteria | C1 – accessibility | 0.62 | 1 |
| C2 – network | 0.11 | 3 | |
| C3 – data | 0.20 | 2 | |
| C4 – support request | 0.06 | 4 |
From a technological standpoint, these results suggest that AquaCrop is increasingly perceived not merely as a standalone model, but rather as a component of web-based, scalable decision support infrastructures. Therefore, ensuring accessibility, interoperability, and efficient data handling becomes essential to maintain the relevance of this model and to facilitate its integration into modern digital agriculture platforms.
The analysis of the weights assigned to the criteria and sub-criteria by the various stakeholders enables the development of a scenario aimed at optimising the use of the AquaCrop model. Table 6 summarises the main priorities identified by each group (farmers, researchers, and IT experts), highlighting the proposed improvement scenario.
| Priority area | Stakeholder(s) | Key criteria/sub-criteria (Weight) | Proposed Action |
|---|---|---|---|
| Streamline input requirements | Farmers | S1C3 – input (0.69) | Develop a simplified user interface with default datasets and an assisted setup wizard |
| Improve accessibility | All groups | C1 – accessibility (0.72 for farmers, 0.69 for researchers, and 0.62 for IT experts); | Improve web interface for low-bandwidth, mobile-friendly, and offline use |
| Enable multi-user features | Researchers and IT experts | S1C2 multi-user (0.55 for researchers and 0.18 for IT experts) | Integrate role-based multi-user access for collaborative use |
| Enhance graphical outputs and visualisation tools | Researchers | S2C3 – graph (0.52) | Expand the dashboard with customisable graphs, real-time simulations, and exportable results |
| Responsive technical support and user feedback mechanisms | All groups | S2C4 – email support (0.79 for IT Experts); C4 – request for support (0.05 for farmers) |
Implement updated FAQs and a responsive email/chat support system with issue tracking |
Overall, the improvement scenario derived from the AHP analysis reinforces the strategic role of AquaCrop as a reference tool for irrigation planning and water productivity assessment. By addressing usability, data handling, and collaborative features, AquaCrop can more effectively bridge the gap between robust biophysical simulation and real-world decision-making, as demonstrated by recent applied and multi-objective implementations (Garofalo et al., 2025; Garofalo, Vonella, 2025).
5. Conclusions
Pressure on water resources and climate variability make it important to develop reliable and flexible crop simulation models. In this context, this study focused on aspects of AquaCrop that could be improved to increase usability and to meet users’ operational needs. Using the AHP, this study sought to translate user feedback into concrete guidelines for the technical and functional development of the model, combining the knowledge of farmers, researchers, and IT experts. The analysis confirmed that the AHP is a robust and transparent approach to capture user preferences and to identify priorities for that can be used to improve the AquaCrop model.
Among the four criteria considered, C3 emerged as one of the most influential for all stakeholder groups. According to the users, criterion C3 is an important feature because the system can be configured to automatically communicate with external Internet of Things platforms. This priority aligns with recent operational applications where AquaCrop integration with spatial databases has enabled automated processing of multiple pedo-climatic scenarios, significantly reducing manual data entry requirements while maintaining model accuracy (Garofalo, Cammerino, 2025). In this regard the improvement scenarios for the AquaCrop tool should consider the significant weights expressed by farmers (0.15) and researchers (0.18). It is also worth highlighting that the sub-criterion related to marketing (S3C2) was rated positively by the farmers (0.15). This demonstrates the interest of farmers in using AquaCrop to add the value of predictive, economic, and controlled management of water resources to their production. This interest is particularly relevant considering that recent studies have demonstrated AquaCrop’s capacity to support comprehensive environmental assessments when integrated with Carbon and Water Footprint analysis tools, enabling farmers to quantify and communicate the sustainability performance of their water management practices (Garofalo, Cammerino, 2025). As suggested by Altobelli et al. (2019, 2021), irrigation advisory services are suitable to promote the adoption of environmental certification systems, such as water footprint, which could improve the sustainability of production processes. Such recognition can increase competitiveness towards the recognition of market value. Moreover, these systems can help provide a very useful and reliable base for the assessment of sustainability in agriculture, also supporting the construction of robust indices for the ongoing switch from the Farm Accounting Data Network to the Farm Sustainability Data Network (Vrolijk, Poppe, 2021).
Triangulation of perspectives allows AquaCrop to be improved in the following ways: (i) simplify data entry with automatic connections to external databases and Internet of Things platforms; (ii) increase accessibility via web and mobile interfaces; (iii) enable multi-user functions for collaborative use; and (iv) strengthen technical support and feedback mechanisms. These results show how the joint participation of users and developers can significantly increase the operational relevance of the model, bridging the gap between scientific modelling and decision-making in the field.
Another aspect worth discussing is that farmers express a particular interest in sharing their experiences on AquaCrop in the form of a network (criterion C2), with a weight of 0.15. In a world where water scarcity defines the conditions for crop growth, AquaCrop is a valuable tool, and its use can be improved and made more efficient by directly involving users. From a public policy perspective, this evidence is fully consistent with the objectives of the CAP for 2023-2027, in particular with the AKIS approach, which promotes cooperation between research, advisory services, and actors in the agricultural sector. The participatory approach adopted in this study is a concrete example of how digital tools such as AquaCrop can be co-developed to become effective elements within AKIS systems, improving knowledge transfer and supporting more sustainable water resource management. Furthermore, by improving the accessibility of the model and user engagement, AquaCrop can contribute to broader sustainability goals, such as reducing inefficiencies in water use, strengthening irrigation advisory services, and developing sustainability indicators.
Taken together, the results highlight that AquaCrop is not merely a crop simulation model; rather, it is a strategic component of modern irrigation decision support systems. The priorities identified through the AHP analysis – particularly data management, accessibility, and user interaction – represent key enabling factors for transforming AquaCrop from a predominantly research-oriented tool into an operational platform capable of supporting farmers, advisors, and policy-driven irrigation strategies. Evidence from recent applied studies confirms that when combined with structured evaluation frameworks, multi-objective optimisation approaches, and environmental assessment tools, AquaCrop can effectively support sustainable water allocation, enhance water productivity, and improve the transparency of irrigation decisions in Mediterranean and other water-limited environments (Garofalo, Cammerino, 2025; Garofalo et al., 2025; Garofalo, Vonella, 2025). These applications demonstrate the model’s capacity to bridge the gap between robust biophysical simulation and real-world decision-making contexts, particularly when user-centred improvements enhance its operational accessibility. From this perspective, the improvement pathways identified in the present study represent a concrete step towards strengthening the role of AquaCrop at the interface between scientific modelling, field-level decision making, and agricultural policy objectives. By systematically addressing the needs expressed by farmers, researchers, and IT experts, the proposed enhancements can facilitate AquaCrop’s evolution into a more integrated, user-friendly platform that serves both agronomic optimisation and sustainability assessment, which are core elements of the AKIS framework promoted by the CAP.
Future research should focus on operational testing of the proposed improvement scenarios in different agro-climatic contexts, assessing their actual impact on user adoption and decision-making efficiency. Further developments may involve integration with real-time data sources, artificial intelligence, and cloud infrastructure to expand AquaCrop’s potential as a decision support tool for precision irrigation and climate-smart agriculture. Ultimately, this study demonstrates that user-centred innovation is not only possible but essential for modelling tools such as AquaCrop to continue to serve as catalysts for more sustainable and resilient agricultural systems.
Author contributions
I.M.D.: Conceptualization, Methodology, Software. P.G., A.P: Data curation, Writing- Original draft preparation. A.M.: Visualization, Investigation. F.A., A.D.M: Supervision. A.K.: Software, Validation: A.M, I.M.D.: Writing- Reviewing and Editing.
References
AbdelRahman M.A.E., Yossif T.M.H., Metwaly M.M. (2025). Enhancing land suitability assessment through integration of AHP and GIS-based for efficient agricultural planning in arid regions. Scientific Reports, 15(1). DOI: https://doi.org/10.1038/s41598-025-14051-7.
Ahmed M. (2020). Systems Modeling. In Systems Modeling. Springer Singapore. DOI: https://doi.org/10.1007/978-981-15-4728-7.
Ali A., Ahmad M., Nawaz M., Sattar F. (2025). Identifying and Prioritizing Spatial Data Required for Effective Agriculture Policymaking: A Comprehensive Analysis Using Analytical Hierarchy Process. Data Intelligence, 7(1): 185-220. DOI: https://doi.org/10.3724/2096-7004.di.2024.0054.
Altobelli F., Del Giudice T., Dalla Marta A. (2019). Adopting irrigation advisory services for water footprint estimation to improving biodiversity conservation: a European survey. Italian Review of Agricultural Economics, 74(3): 23-28. DOI: https://doi.org/10.13128/rea-11209.
Altobelli F., Henke R. (2024). Economic strategies and policy suggestions of agricultural sustainable food production. Agriculture, 14(3). DOI: https://doi.org/10.3390/agriculture14030504.
Altobelli F., Dalla Marta A., Heinen M., Jacobs C., Giampietri E., Mancini M., Cimino O., Trestini S., Kranendonk R., Chanzy A. (2021). Irrigation Advisory Services: Farmers preferences and willingness to pay for innovation. Outlook on Agriculture, 50(3): 277-285. DOI: https://doi.org/10.1177/00307270211002848.
Beiderbeck D., Frevel N., von der Gracht H., Schmidt S., Schweitzer V. (2021). Preparing, Conducting, and Analyzing Delphi Surveys: Cross-disciplinary Practices, New Directions, and Advancements. MethodsX, 8, 101401. DOI: https://doi.org/10.1016/j.mex.2021.101401.
Benítez J., Delgado-Galván X., Izquierdo J., Pérez-García R. (2012). Improving consistency in AHP decision-making processes. Applied Mathematics and Computation, 219(5): 2432-2441. DOI: https://doi.org/10.1016/j.amc.2012.08.079.
Cay T., Uyan M. (2013). Evaluation of reallocation criteria in land consolidation studies using the Analytic Hierarchy Process (AHP). Land Use Policy, 30(1): 541-548. DOI: https://doi.org/https://doi.org/10.1016/j.landusepol.2012.04.023.
Chapagain R., Remenyi T.A., Harris R.M.B., Mohammed C.L., Huth N., Wallach D., Rezaei E.E., Ojeda J.J. (2022). Decomposing crop model uncertainty: A systematic review. Field Crops Research, 279, 108448. DOI: https://doi.org/10.1016/J.FCR.2022.108448.
De Castro P., Miglietta P.P., Vecchio Y. (2020). The Common Agricultural Policy 2021-2027: a new history for European agriculture. Italian Review of Agricultural Economics, 75(3): 5-12. DOI: https://doi.org/10.13128/rea-12703.
De Felice F., Petrillo A. (2013). Absolute measurement with analytic hierarchy process: a case study for Italian racecourse. International Journal of Applied Decision Sciences, 6(3): 209-227. DOI: https://doi.org/10.1504/IJADS.2013.054931.
Donati I.I.M., Viaggi D., Srdjevic Z., Srdjevic B., Di Fonzo A., Del Giudice T., Cimino O., Martelli A., Dalla Marta A., Henke R., Altobelli F. (2023). An Analysis of Preference Weights and Setting Priorities by Irrigation Advisory Services Users Based on the Analytic Hierarchy Process. Agriculture (Switzerland), 13(8). DOI: https://doi.org/10.3390/agriculture13081545.
Elolu S., Förster N., Opiyo A.M., Huyskens-Keil S. (2025). Evaporative cold storage for African indigenous vegetables: A SWOT-AHP analysis of stakeholders’ perceptions and its impact on the quality of Amaranth and African nightshade. Journal of Agriculture and Food Research, 21. DOI: https://doi.org/10.1016/j.jafr.2025.101949.
Forman E.H. (1993). Facts and fictions about the analytic hierarchy process. Mathematical and Computer Modelling, 17(4-5): 19-26. DOI: https://doi.org/10.1016/0895-7177(93)90172-U.
Foster T., Brozović N., Butler A.P., Neale C.M.U., Raes D., Steduto P., Fereres E., Hsiao T.C. (2017). AquaCrop-OS: An open source version of FAO’s crop water productivity model. Agricultural Water Management, 181, 18-22. DOI: https://doi.org/10.1016/j.agwat.2016.11.015.
García-Vila M., Fereres E., Mateos L., Orgaz F., Steduto P. (2009). Deficit irrigation optimization of cotton with aquacrop. Agronomy Journal, 101(3): 477-487. DOI: https://doi.org/10.2134/agronj2008.0179s.
Giardini L. (2012). L’agronomia per conservare il futuro (Pàtron, Ed.; 6th ed.).
Ishizaka A., Balkenborg D., Kaplan T. (2011). Does AHP help us make a choice? An experimental evaluation. Journal of the Operational Research Society, 62(10): 1801-1812. DOI: https://doi.org/10.1057/jors.2010.158.
Ishizaka A., Labib A. (2009). Analytic Hierarchy Process and Expert Choice: Benefits and limitations. OR Insight, 22(4): 201-220. DOI: https://doi.org/10.1057/ori.2009.10.
Ishizaka A., Labib A. (2011). Review of the main developments in the analytic hierarchy process. Expert Systems with Applications, 38(11), 14336-14345. DOI: https://doi.org/10.1016/J.ESWA.2011.04.143.
Ishizaka A., Lusti M. (2006). How to derive priorities in AHP: a comparative study. Central European Journal of Operations Research, 14(4): 387-400. DOI: https://doi.org/10.1007/s10100-006-0012-9.
Ishizaka A., Pearman C., Nemery P. (2012). AHPSort: An AHP-based method for sorting problems. International Journal of Production Research, 50(17): 4767-4784. DOI: https://doi.org/10.1080/00207543.2012.657966.
Ishizaka A., Nemery P. (n.d.). Multi-criteria decision analysis : methods and software.
Kasampalis D.A., Alexandridis T.K., Deva C., Challinor A., Moshou D., Zalidis G. (2018). Contribution of remote sensing on crop models: A review. In Journal of Imaging (Vol. 4, Number 4). MDPI. DOI: https://doi.org/10.3390/jimaging4040052.
Knierim A., Birke F.M. (2023). Visualised AKIS Diagnosis – an Instrumental Approach to Support AKIS Appraisal. EuroChoices, 22(2): 59-70. DOI: https://doi.org/10.1111/1746-692X.12397.
Labarthe P., European Seminar on Extension & Education (26: 2023: Toulouse). (2023). Sustainability transitions of agriculture and the transformation of education and advisory services: convergence or divergence? book of abstracts : 26th European Seminar on Extension & Education, Toulouse, 10-13 July 2023. UMR AGIR.
Lane E., Verdini W. (2007). A Consistency Test for AHP Decision Makers. Decision Sciences, 20: 575-590. DOI: https://doi.org/10.1111/j.1540-5915.1989.tb01568.x.
O. Rauff K., Bello R. (2015). A Review of Crop Growth Simulation Models as Tools for Agricultural Meteorology. Agricultural Sciences, 06(09): 1098-1105. DOI: https://doi.org/10.4236/as.2015.69105.
Proietti P., Cristiano S. (2023). Innovation support services: an evidence-based exploration of their strategic roles in the Italian AKIS. Journal of Agricultural Education and Extension, 29(3): 351-371. DOI: https://doi.org/10.1080/1389224X.2022.2069828.
Raes D., Steduto P., Hsiao T.C., Fereres E. (2009). Aquacrop-The FAO crop model to simulate yield response to water: II. main algorithms and software description. Agronomy Journal, 101(3): 438-447. DOI: https://doi.org/10.2134/agronj2008.0140s.
Release Note AquaCrop Version 7.1 FAO. (n.d.).
Roja M., Gumma M.K., Reddy M.D. (2023). Crop modelling in agricultural crops. Review Articles Current Science, 124(8). DOI: https://doi.org/10.18520/cs/v124/i8/910-920.
Saaty R.W. (1987). The Analytic Hierarchy Process – What it is and how it is used. Mathematical Modeling, 9(3-5): 161-176. DOI: https://doi.org/10.1016/0270-0255(87)90473-8.
Saaty T.L. (2004). Decision making – The Analytic Hierarchy and Network Processes (AHP/ANP). Journal of Systems Science and Systems Engineering, 13(1): 1-35. DOI: https://doi.org/10.1007/s11518-006-0151-5.
Saaty T.L. (2008). Decision making with the analytic hierarchy process. International Journal of Services Sciences, 1(1): 83-98. DOI: https://doi.org/10.1504/IJSSci.2008.01759.
Saaty T.L., Ozdemir M. (2003). Negative priorities in the Analytic Hierarchy Process. Mathematical and Computer Modelling, 37(9-10): 1063-1075. DOI: https://doi.org/10.1016/S0895-7177(03)00118-3.
Saaty T.L., Vargas L.G. (2012). Models, Methods, Concepts & Applications of the Analytic Hierarchy Process. Springer, New York. DOI: https://doi.org/10.1007/978-1-4614-3597-6.
Seidel S.J., Palosuo T., Thorburn P., Wallach D. (2018). Towards improved calibration of crop models – Where are we now and where should we go? European Journal of Agronomy, 94, 25-35. DOI: https://doi.org/10.1016/j.eja.2018.01.006.
Steduto P., Hsiao T.C., Raes D., Fereres E. (2009). Aquacrop-the FAO crop model to simulate yield response to water: I. concepts and underlying principles. Agronomy Journal, 101(3): 426-437. DOI: https://doi.org/10.2134/agronj2008.0139s.
Steduto P., Raes D., Hsiao T.C., Fereres E., Heng L.K., Howell T.A., Evett S.R., Rojas-Lara B.A., Farahani H.J., Izzi G., Oweis T.Y., Wani S.P., Hoogeveen J., Geerts S. (n.d.). Concepts and Applications of AquaCrop: The FAO Crop Water Productivity Model.
Sutherland L.A., Adamsone-Fiskovica A., Elzen B., Koutsouris A., Laurent C., Stræte E.P., Labarthe P. (2023). Advancing AKIS with assemblage thinking. Journal of Rural Studies, 97: 57-69. DOI: https://doi.org/10.1016/j.jrurstud.2022.11.005.
Van Oost I., Vagnozzi A. (2020). Knowledge and innovation, privileged tools of the agro-food system transition towards full sustainability. Italian Review of Agricultural Economics, 75(3): 33-37. DOI: https://doi.org/10.13128/rea-12707.
Vanuytrecht E., Raes D., Steduto P., Hsiao T.C., Fereres E., Heng L.K., Garcia Vila M., Mejias Moreno P. (2014). AquaCrop: FAO’s crop water productivity and yield response model. Environmental Modelling and Software, 62: 351-360. DOI: https://doi.org/10.1016/j.envsoft.2014.08.005.
Vrolijk H., Poppe K. (2021). Article cost of extending the farm accountancy data network to the farm sustainability data network: Empirical evidence. Sustainability (Switzerland), 13(15). DOI: https://doi.org/10.3390/su13158181.
Winn C.A., Archontoulis S., Edwards J. (2023). Calibration of a crop growth model in APSIM for 15 publicly available corn hybrids in North America. Crop Science, 63(2): 511-534. DOI: https://doi.org/10.1002/csc2.20857.
Appendix