https://doi.org/10.36253/rea-16734
Received: September 12, 2025; Revised: January 26, 2026; Accepted: February 20, 2026
Research article
Evaluating the applicability of the european voluntary sustainability reporting standards for agrifood small- medium-sized enterprises
Department of Economics and Management, University of Parma, Italy
*Corresponding author. E-mail: teresa.tugliani@unipr.it
Abstract. Sustainability reporting is a corporate social responsibility tool that engages businesses in sustainable practices and enables them to communicate their impacts to stakeholders. In the Italian Agrifood sector, small and medium-sized enterprises (SMEs) have an important role in the value chain but often lack the resources and skills to properly report their sustainability impacts. This study evaluates the potential capacity of agrifood SMEs to comply with and apply the Voluntary Sustainability Reporting Standards for Non-listed SMEs (VSME), using the Global Reporting Initiative (GRI) framework as a proxy. Using content analysis, 16 sustainability reports by Italian agrifood SMEs are examined in terms of material topics, use and informative coverage of GRI standards, and their correspondence with VSME indicators. The results reveal that social and environmental GRI topics and indicators are more frequently disclosed by SMEs, while economic topics receive limited attention. Moreover, comparison between GRI use and VSME requests highlights the absence of some specific agrifood sector indicators (biodiversity, soil health, pesticide use, local community impact, and product quality). Furthermore, the value chain perspective is weak in the VSME guidelines and in SME reporting. In conclusion, the VSME framework represents a starting point that requires refinement and dialogue between stakeholders to better support SME reporting. This study provides empirical insight into the underexplored segment of the sustainability reporting of agrifood SMEs.
Keywords: sustainability reporting, SMEs, agrifood, GRI, ESRS.
JEL codes: Q56, M48.
Contents
2. Conceptual framework: the ESRS and GRI reporting systems
3.3. Comparative analysis between the GRI standards used and the ESRS framework
4.1. Categorisation of the material topics
4.2. Frequency of use and disclosure coverage of the GRI standards
4.3. Potential adoption of the VSME for agrifood SMEs
Highlights
- –The VSME framework can represent a starting point for agrifood SME reporting, but it requires refinement and dialogue between stakeholders.
- –The VSME framework lacks detail on some environmental (biodiversity, soil health, and pesticide use) and social (local community and product quality) indicators, which are key to the sustainability commitments of agrifood SMEs.
- –The inclusion of supply chain impacts is still weak.
- –Associations and intermediary bodies could act as facilitators, supporting SMEs in sustainability reporting.
1. Introduction
The European Union’s Green Deal Industrial Plan, established within the broader framework of the European Green Deal, underscores Europe’s ambition to become a global leader in the sustainability transition, targeting climate neutrality by 2050 (EEA, 2024). A pivotal component driving this agenda is Directive 2022/2464 of the European Parliament and of the Council, known as the Corporate Sustainability Reporting Directive (CSRD), which contains the European Sustainability Reporting Standards (ESRS) developed by the European Financial Reporting Advisory Group (EFRAG). According to the Directive (EU) 2022/2464 (2022: 42), conceptually “sustainability reporting” means “reporting information related to sustainability matters”, and this includes disclosing all activities, impacts, and commitments of the reporting entity – whether public or private – from an environmental, social, and governance (ESG) perspective. This practice enables businesses to communicate their sustainability efforts and outcomes to a diverse group of stakeholders, including investors, customers, and policymakers. Specifically, the aim of the ESRS is to align and enhance transparency and comparability in companies’ sustainability performance reporting on ESG impacts, which are key drivers of decisions for investors and stakeholders (Baumüller, Grbenic, 2021; Arkoh et al., 2023; Fornasari, Traversi, 2024). Indeed, the ESRS were developed from a collaboration between EFRAG and other independent standards organisations, chiefly the Global Reporting Initiative (GRI).
The agrifood sector stands out in this context because its transition represents a key step towards a sustainable Europe, as emphasised by the European Green Deal. The latter, through the Farm to Fork Strategy (F2FS), is centred on the agrifood sector (European Commission, 2020) due to its significant sustainability impacts on: air, water and soil pollution (Castillo-Díaz et al., 2023); greenhouse gas emissions and climate change effects (European Commission, 2020; Tubiello et al., 2022); living standards, human health implications, and working conditions (Myers et al., 2017). The sector’s systemic importance is evident in its role across production, consumption, and waste management, with impacts on the European economy, environment, and social structures.
A fundamental characteristic of the European agrifood industrial ecosystem, which includes upstream, midstream, and downstream businesses, is that over 99% of it is composed of small and medium-sized enterprises (SMEs), which account for 40.1% of the sector’s turnover and employ 56.7% of sector operators (Eurostat data 2021 in FoodDrinkEurope, 2024). Italy is a European leader in the food and beverage sector, accounting for 17% of EU enterprises and generating 12.5% of the total sector turnover in the EU in 2022 (FoodDrinkEurope, 2024). Within the Italian manufacturing industry, in 2022 the food and beverage sector accounted for 14.5% of all enterprises, 12.9% of total manufacturing turnover, and 11.3% of all employees. The structure of the Italian food and beverage sector is predominantly composed of SMEs, which make up almost 99% of the industry, generate 40.6% of the sector’s total turnover, and employ 69.3% of its workforce (SACE, 2024).
Despite the relevance and prevalence of SMEs, highlighting their potential influence and impact in the value chains, sustainability reporting is still an unfamiliar practice to many (Rodríguez-Gutiérrez et al., 2021). This is due to the many challenges they face: (i) a limited amount of data to produce quality information (Girella et al., 2019; Marconati, 2024); (ii) limited data collection systems and capacity to process data (Girella et al., 2019; Marconati, 2024); (iii) a lack of skills and specialised personnel (Del Baldo, 2017; Girella et al., 2019; Marconati, 2024); (iv) a lack of entrepreneurial vision and attitudinal and cultural barriers linked to resistance to change (Del Baldo, 2017; Marconati, 2024; Tombolesi, 2024); (v) internal organisation and governance often based on a family-owned structure (Del Baldo, 2017; Marconati, 2024); (vi) a lack of financial resources and increasing bureaucratic and administrative burdens (Rodríguez-Gutiérrez et al., 2021; Giarratana, 2023; Marconati, 2024; Briamonte, Scarpato, 2025); and (vii) a lack of standardised criteria and indicators for the preparation of non-financial reports (Giarratana, 2023; Marconati, 2024). This phenomenon is particularly relevant in Italy, where micro and small businesses demonstrate difficulty in reporting their actions, especially those that are led by informal, non-codified procedures. Such actions fall within the area of ‘health and safety in the workplace’, the ‘internal organisational dimension’, ‘training’, and ‘benefits and services for employees’ (Briamonte, Hinna, 2008).
Overall, the main benefit expected by SMEs from sustainability reporting is the acquisition of financial benefits by leveraging reports to enhance their reputation and legitimacy (Rodríguez-Gutiérrez et al., 2021; Marconati, 2024). In fact, the literature confirms the positive relationship between sustainability performance and financial benefits (Tombolesi, 2024). On the one hand, businesses that are attentive to environmental and social issues and have a good governance system are less exposed to the risks arising from changes in the economic system (Tombolesi, 2024). On the other hand, the development of medium- to long-term sustainability strategies makes it possible to acquire competitive advantages and identify strategic opportunities (Marconati, 2024). Moreover, Briamonte, Hinna (2008) suggest that accountability tools can offer a competitive edge to agrifood businesses in general, allowing them to report on additional quality elements such as country of origin, the nutritional content, and ethical and social factors, including workers’ rights and welfare. Nevertheless, there is still a risk that reporting could become abstract, with good intentions failing to translate into actionable measures.
The centrality of both the agrifood sector and SMEs is highlighted by the ESRS framework. First, separate ESRS guidelines for the ‘Agriculture, Farming and Fishing Sector’ and the ‘Food & Beverage Sector’ are under development, but this work is currently in a very early stage. Second, SMEs are considered key actors as ‘suppliers or clients in the value chains’ and are considered in terms of the administrative and financial difficulties that they encounter. EFRAG has developed two specific sets of ESRS, although they have not yet been adopted: one for listed SMEs – Sustainability Reporting standard for Listed SMEs (LSME) – obliged to report on sustainability impacts (EFRAG, 2025a), and one for those who will voluntarily report – Voluntary Sustainability Reporting Standards for Non-listed SMEs (VSME). The latter is of particular importance in this study as it applies to the majority of Italian SMEs. Indeed, an analysis of the 127 Italian listed SMEs in 2024, published by the National Commission for Companies and the Stock Exchange (CONSOB, 2025), reveals that less than 5% operate in the agrifood sector. Thus, most agrifood SMEs fall under the VSME set.
There is growing academic interest in studies on sustainability reporting (Calabrese et al., 2019; Elalfy et al., 2021; Arkoh et al., 2023), including for SMEs (Del Baldo, 2017; Girella et al., 2019; Steinhöfel et al., 2019; Donnari, 2023; Giarratana, 2023; Marconati, 2024; Tombolesi, 2024) and sectors with a high environmental impact, specifically the food and beverage industry (Topp-Becker, Ellis, 2017; Stranieri et al., 2019; Arkoh et al., 2023; Briamonte et al., 2024). However, there has been little research on how SMEs in the agrifood sector approach sustainability reporting (Briamonte, Scarpato, 2025), highlighting the need for further exploration (Celli et al., 2024; Ortiz-Martínez, Marín-Hernández, 2023). This study aims to fill this gap by analysing the current sustainable reporting of agrifood SMEs, seeking to understand whether the new VSME is applicable and consistent with the agrifood sector. To this end, this study includes a comparative analysis between the two reporting frameworks, GRI and VSME, and an applicability analysis of the VSME by agrifood SMEs that adopt the GRI framework. Specifically, the study aims (i) to analyse the GRI in terms of the material topics and standards predominantly used by agrifood SMEs; (ii) to compare the potential use of the VSME by agrifood SMEs; and (iii) to evaluate the differences between the GRI standard and the VSME with a focus on shortcomings in the sustainability assessment of businesses in the agrifood sector.
The rest of this paper is organised as follows. Section 2 describes the conceptual framework for this paper, focusing on the ESRS and GRI reporting systems and especially on the VSME. Section 3 defines the sample and describes the qualitative methodology adopted in the analysis. Section 4 presents the main results in terms of materiality, GRI usage, and the potential adoption of the ESRS by agrifood SMEs. Section 5 discusses the results. Finally, Section 6 concludes the paper.
2. Conceptual framework: the ESRS and GRI reporting systems
The alignment and standardisation of sustainability reporting is guaranteed by the collaboration between EFRAG and many existing entities, standards, and accountability frameworks (EFRAG, 2025b). In particular, the ESRS were developed in cooperation with the GRI under the July 2021 expertise-sharing agreement, to unify accountability principles at the European level through the technical guidance of EFRAG (GRI, EFRAG, 2023; EFRAG, 2025b). Moreover, the GRI framework is characterised by the considerable freedom and flexibility afforded to businesses in its adoption, favouring a high degree of subjectivity. Although this characteristic allows the framework to be adopted by any business, it also makes it challenging to apply properly, especially for SMEs (Bellantuono et al., 2018; Calabrese et al., 2019; Torelli et al., 2020).
The GRI is an independent international organisation that was founded in 1997 in Boston (United States) to develop accountability guidelines in matters of sustainability (Massari, Giannoccaro, 2023; Zharfpeykan, Akroyd, 2023; GRI, 2025a). The GRI standards have been recognised as the most credible and have been used internationally (Arena, Azzone, 2012; Girella et al., 2019; Stranieri et al., 2019; Rodríguez-Gutiérrez et al., 2021; Zharfpeykan, Akroyd, 2023). Over the years, GRI development efforts have contributed to the spread of non-financial reporting practices across various sectors thanks to the provision of guidelines and standards (Bartolacci et al., 2020). Indeed, the GRI standards provide a flexible framework that is adaptable to any sector and management strategy (Massari, Giannoccaro, 2023).
The GRI framework suggests starting reporting activities with the materiality assessment. This consists of identifying relevant topics to the business, considering both internal and external perspectives (Zharfpeykan, Akroyd, 2023). The latter refers to the involvement of stakeholders, considering their opinion on the impacts of business activities (GRI, 2022). This process provides thematic guidelines for businesses to cover all relevant aspects of sustainability in the economic, environmental, and social spheres. The GRI standards are divided into Universal Standards (transversal standards relating to fundamental principles, general disclosures, and material topics), Sector Standards (sector-specific sets of standards and material topics), and Specific Standards. The latter are grouped into three series: (i) GRI 200 (economic disclosures), (ii) GRI 300 (environmental disclosures), and (iii) GRI 400 (social disclosures) (Massari, Giannoccaro, 2023; GRI, n.d.). Moreover, each Specific and Universal Standard provides a list of disclosures, indicating information requirements, recommendations, and guidelines. None of the disclosures are mandatory, nor do they present precise calculation indicators: businesses that decide to report on individual disclosures will find the corresponding required, recommended, and guideline information.
In this context, the ESRS were introduced to streamline and standardise reporting requirements, providing unique guidance for reporting businesses and helping recipients (e.g., investors) read and compare information (Baumüller, Grbenic, 2021). As stated in the CSRD and in the Commission Delegated Regulation (EU) 2023/2772, the ESRS are structured into 12 standards grouped as follows: (i) two general (1 – General requirements; 2 – General disclosures), (ii) five environmental (E1 – Climate change; E2 – Pollution; E3 – Water and marine resources; E4 – Biodiversity and ecosystems; E5 – Resource use and circular economy), (iii) four social (S1 – Own workforce; S2 – Workers in the value chain; S3 – Affected communities; S4 – Consumers and end-users), and (iv) one governance (G1 – Business conduct). The specific LSME and VSME sets provide additional simplifications to meet the needs of SMEs.
The VSME is structured as follows: the Basic Module comprises 11 reportable standards (the minimum required), and the Comprehensive Module covers additional issues that are likely to be requested by banks, investors, and corporate clients. This simplification is underscored by the central principle guiding the reporting: instead of the materiality assessment, which involves stakeholders’ interests and perceptions, the VSME is based on the ‘if applicable’ principle (EFRAG, 2024). Moreover, the ESRS are designed to provide a more simplified approach to sustainability reporting, offering specific indicators and streamlining the topics that need to be addressed while maintaining an alignment with the previous GRI framework.
3. Research design
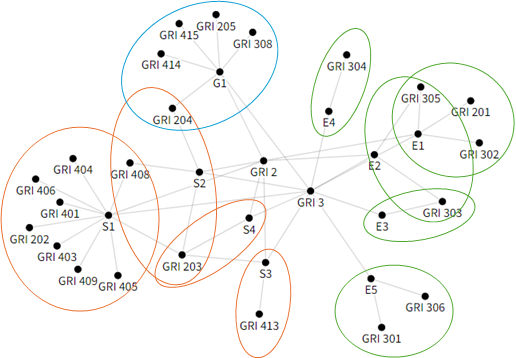
In light of the robust interoperability between the ESRS and GRI (GRI, EFRAG, 2023) and the latter’s adaptability to the context of SMEs (Rodríguez-Gutiérrez et al., 2021), this study uses the GRI as a proxy for the potential use of the ESRS by agrifood SMEs. Each ESRS (G – governance, S – social, and E – environmental) corresponds to one or more GRI standards covering the same disclosure topics, demonstrating the interoperability between the two frameworks (Figure 1). For example, Standard E2 (pollution) is covered by GRI 303 (water and effluents) and GRI 305 (emissions). Moreover, GRI Universal Standards 2 and 3 intersect with all ESRS due to their transversal and methodological scope. Through a concordance approach between frameworks, the applicability of the VSME was investigated indirectly by analysing GRI reports.
3.1. Sample selection
To analyse the adoption of sustainability reporting by agrifood SMEs in the national context, the sustainability reports of Italian businesses meeting the following criteria were selected and analysed:
- –qualification as SMEs: fewer than 250 employees, turnover of less than 50 million euros, or a total balance sheet of less than 43 million euros;
- –operating in the agrifood sector;
- –adherence to the GRI reporting framework (Stranieri et al., 2019).
The analysis focused on the Emilia-Romagna region in north-east Italy. Known as the ‘Food Valley’ of Italy, Emilia-Romagna is renowned for its agrifood production sector, characterised by its exceptional variety of high-quality agricultural products (Leardini, Serventi, 2016). Emilia-Romagna’s agrifood sector accounts for over 15% of Italy’s export value, is composed of more than 60,000 businesses, and employs nearly 150,000 people, highlighting its socioeconomic importance. Its economic relevance is also reflected in the region’s added value per capita, which is €2150 – well above Italy’s average of €1332 (Regione Emilia-Romagna, 2024). Furthermore, Emilia-Romagna has the second highest percentage of SMEs in the agrifood sector (2%) in Italy after Umbria (2.9%), exceeding the Italian average (1.6%) by 0.4% in 2023 (Confindustria, Cerved, 2023). Therefore, Emilia-Romagna is a relevant context for analysing the sustainability commitment of businesses.
The sample was built consulting the ‘Top 500’ businesses list edited by KPMG Emilia-Romagna in collaboration with Confindustria Emilia-Romagna, based on an analysis of public financial statements. A sample of 204 SMEs operating in the agrifood sector in Emilia-Romagna was formed from:
- –the ninth edition of Top 500 Parma businesses in terms of turnover based on 2022 data in the province of Parma (110 agrifood SMEs – 54% of the total sample);
- –the ninth edition of Top 500 Bologna businesses in terms of turnover based on 2022 data in the province of Bologna (41 agrifood SMEs – 20% of the total sample);
- –the ninth edition of Top 500 Piacenza businesses in terms of turnover based on 2022 data in the province of Piacenza (42 agrifood SMEs – 21% of the total sample).
To broaden the sample and to support the research with positive examples, other sources were consulted:
- –a report by Corriere della Sera (2022) in collaboration with the Bologna Business School on 51 businesses that received awards for their sustainability reports (7 agrifood SMEs – 3% of the total sample);
- –the suggestions of academic experts in the field (4 agrifood SMEs – 2% of the total sample).
Out of the sample of 204 agrifood SMEs, 63.73% (130 businesses) do not report on their sustainability commitments. The remaining 36.27% (74 businesses) communicate their sustainability efforts in different ways. Specifically, 31.08% have a dedicated section on their corporate website where they present their vision, commitments, and often the goals they have achieved in terms of sustainability. However, the content of these sections varies considerably across businesses, and the level of detail and depth is largely at the discretion of each business, making this source unsuitable for systematic analysis. The same applies to non-GRI reports (10.81%), which are not systematically comparable. By contrast, 21.62% (17 businesses) adopt the GRI standards as their reporting framework. Because this method provides a comprehensive document that usually also includes the information available on corporate websites and certifications, the sustainability reports of these 17 businesses were analysed (Table 1).
| Sustainability communication method | % in the sample | ||||||||||||||||||
|---|---|---|---|---|---|---|---|---|---|---|---|---|---|---|---|---|---|---|---|
| Dedicated section on corporate website | 31.08 | ||||||||||||||||||
| GRI report | 21.62 | ||||||||||||||||||
| Environmental certifications | 20.27 | ||||||||||||||||||
| EMAS verified environmental management statement | 18.92 | ||||||||||||||||||
| Non-GRI report | 10.81 | ||||||||||||||||||
| Integrated corporate policy | 9.46 | ||||||||||||||||||
| Corporate social responsibility policy | 4.05 | ||||||||||||||||||
| Corporate environmental policy | 2.70 | ||||||||||||||||||
| Note: the percentage is calculated based on 74 of the 204 agrifood SMEs in the sample (36.27%). This is because some businesses adopt multiple methods for communicating their sustainability efforts. | |||||||||||||||||||
| Source: authors’ elaboration based on data from business databases. | |||||||||||||||||||
Of the 17 businesses with a GRI Report (7.84% of the total sample), one had to be excluded because it did not declare the GRI Specific Standards it adopted. The 16 selected businesses are medium-sized (with the exception of one small company) and belong to the following commodity sectors: chocolate (1 business), dressing products (1 business), flours (1 business), vegetable oil (2 businesses), pasta (1 business), seafood (2 businesses), fruit and vegetable products (2 businesses), cured meats (2 businesses), wine products (2 businesses), and multiple food products (2 businesses).
3.2. Content analysis
The 16 sustainability reports were analysed using content analysis, ‘a research method that uses a set of procedures to make valid inferences from text’ (Weber, 1990: 9). This method allows information in text to be coded, transforming qualitative data into quantitative forms. This characteristic makes content analysis particularly effective in the analysis of corporate reporting documents (Torelli et al., 2020) and social and environmental accountability reporting (Guthrie, Abeysekera, 2006; Arkoh et al., 2023).
To overcome the potential limitation in assessing the quality of reporting – usually focused more on quantity – the frequency of reporting (Guthrie, Parker, 1990) and the extent of the information disclosed (Deegan, Gordon, 1996; Deegan, Rankin, 1996) were considered to deduce quality (Guthrie, Abeysekera, 2006). As such, content analysis focused on the following aspects:
- –Material topics and stakeholder categorisation:
- •the list of stakeholders involved in the materiality assessment was grouped into categories, and the frequency of citation of each stakeholder category was calculated;
- •the list of material topics declared was labelled according to the GRI Specific Standards (GRI, 2024) and the material topics listed in the GRI 13 Sector Standard (GRI, 2023a). When a direct correspondence with GRI nomenclature was missing, the topics were organised by adopting alternative labels, as in the case of ‘stakeholder engagement’, ‘ethics and integrity’, ‘innovation, research and development’, and ‘human rights’. Afterwards, the organised topics were grouped into the social, environmental, and economic categories.
- –GRI frequency of use was calculated as the percentage of SMEs adopting each GRI Specific Standard relative to the total number of SMEs analysed. This metric identified the most commonly used GRI Specific Standards.
- –GRI disclosure coverage was calculated for each GRI standard as the average percentage of disclosures reported by the SMEs analysed relative to the total requested, the metric assesses the completeness of the reports.
3.3. Comparative analysis between the GRI standards used and the ESRS framework
Finally, a comparative analysis was conducted between the VSME set and GRI disclosures using ESRS-GRI Standards data point mapping (GRI, 2023b; EFRAG, 2023b) as a benchmark. This tool facilitated a cross-reference between the adoption of the GRI standards and their corresponding VSME standards and indicators. Consequently, this approach makes it possible to evaluate the alignment between the material topics of SMEs, their ability to translate them into GRI standards, and their potential capacity to comply with and apply the VSME framework.
4. Results
4.1. Categorisation of the material topics
Although SMEs are not required to conduct materiality assessment, 12 out of 16 SMEs in the final sample (75%) chose reporting standards based on a materiality assessment involving their main stakeholders (Table 2). The main stakeholders involved are the key actors engaged with the operational activities of the reporting businesses, such as employees and partners, which are considered internal actors, and suppliers and business-to-business (B2B) clients, which are external actors. Strong consideration is also given to external actors connected with the territory and local society, such as local associations and non-governmental organisations (NGOs), civil society, and local and public institutions. Finally, the sampled businesses also questioned final consumers, universities, banks, and professional unions, albeit less frequently.
| Stakeholders | Type of stakeholder | Frequency | |
|---|---|---|---|
| Number | % | ||
| Employees and partners | Internal | 12 | 100.0 |
| Suppliers | External | 12 | 100.0 |
| B2B clients | External | 11 | 91.7 |
| Local community and civil society | External | 10 | 83.3 |
| Institutions and public authorities | External | 10 | 83.3 |
| Professional unions | External | 8 | 66.7 |
| Customers | External | 8 | 66.7 |
| Media and press | External | 8 | 66.7 |
| Research institutions and universities | External | 7 | 58.3 |
| Insurance companies, banks and lending institutions | External | 7 | 58.3 |
| Shareholders and investors | Internal/external | 5 | 41.7 |
| Labour unions | External | 3 | 25.0 |
| Internal governance | Internal | 3 | 25.0 |
| Certifying and auditing bodies | External | 2 | 16.7 |
| Competitors | External | 1 | 8.3 |
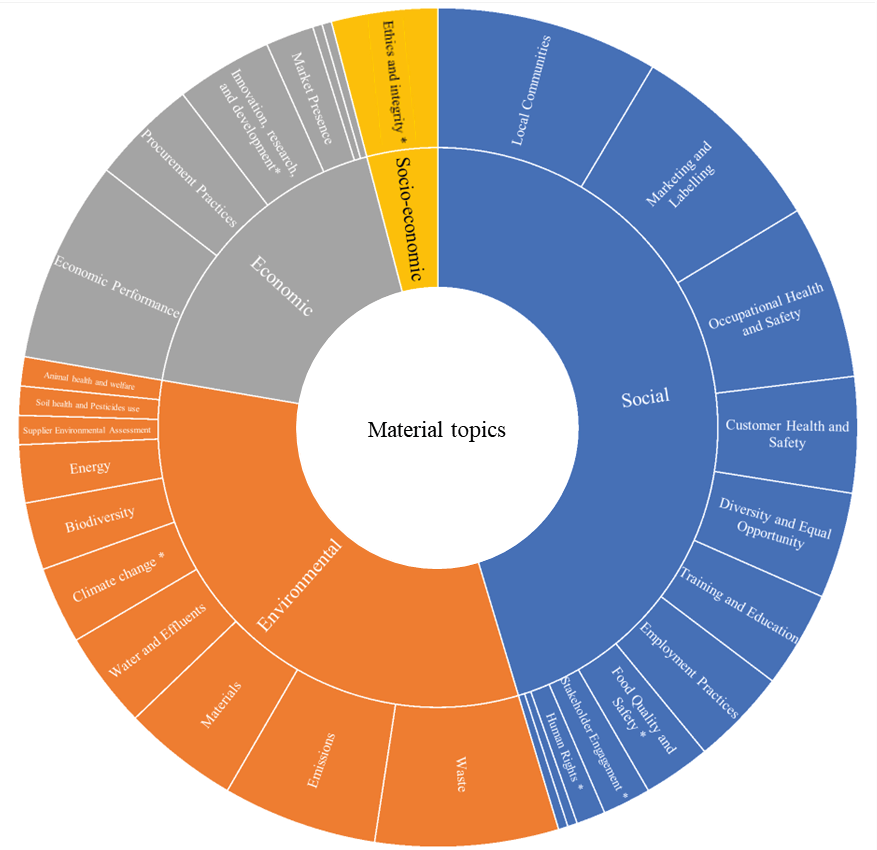
The results show that in most cases, the identified material topics address social aspects (44.69%), followed by environmental (33.33%), economic (17.95%), and socio-economic (4.03%) aspects (Figure 2). More specifically, the most commonly cited topics are: ‘local communities’ (8.6%), ‘marketing and labelling’ (7.8%) and ‘occupational health and safety’ (6.7%), for the social category; ‘waste’ (7.1%) and ‘emissions’ (6%), for the environmental category; and ‘economic performance’ (7.8%), for the economic category. The material topic ‘ethics and integrity’ (4.1%) addresses both economic and social issues. In fact, each business interpreted it by addressing various topics, such as corporate governance and vision, corporate ethics behaviour (e.g., anti-corruption and anti-competitive), and child labour. Note that this heading is not included among the GRI but has been proposed by the businesses themselves.
4.2. Frequency of use and disclosure coverage of the GRI standards
The 16 sampled food businesses use an average of 17.6 GRI standards in their reports, or 56.85% of those available. In general, the results highlight that standards are not used in the same way by businesses in terms of frequency of use or disclosure coverage. The majority are used by less than 50% of the sample and the full range of disclosures requested is never completely covered (Figure 3).
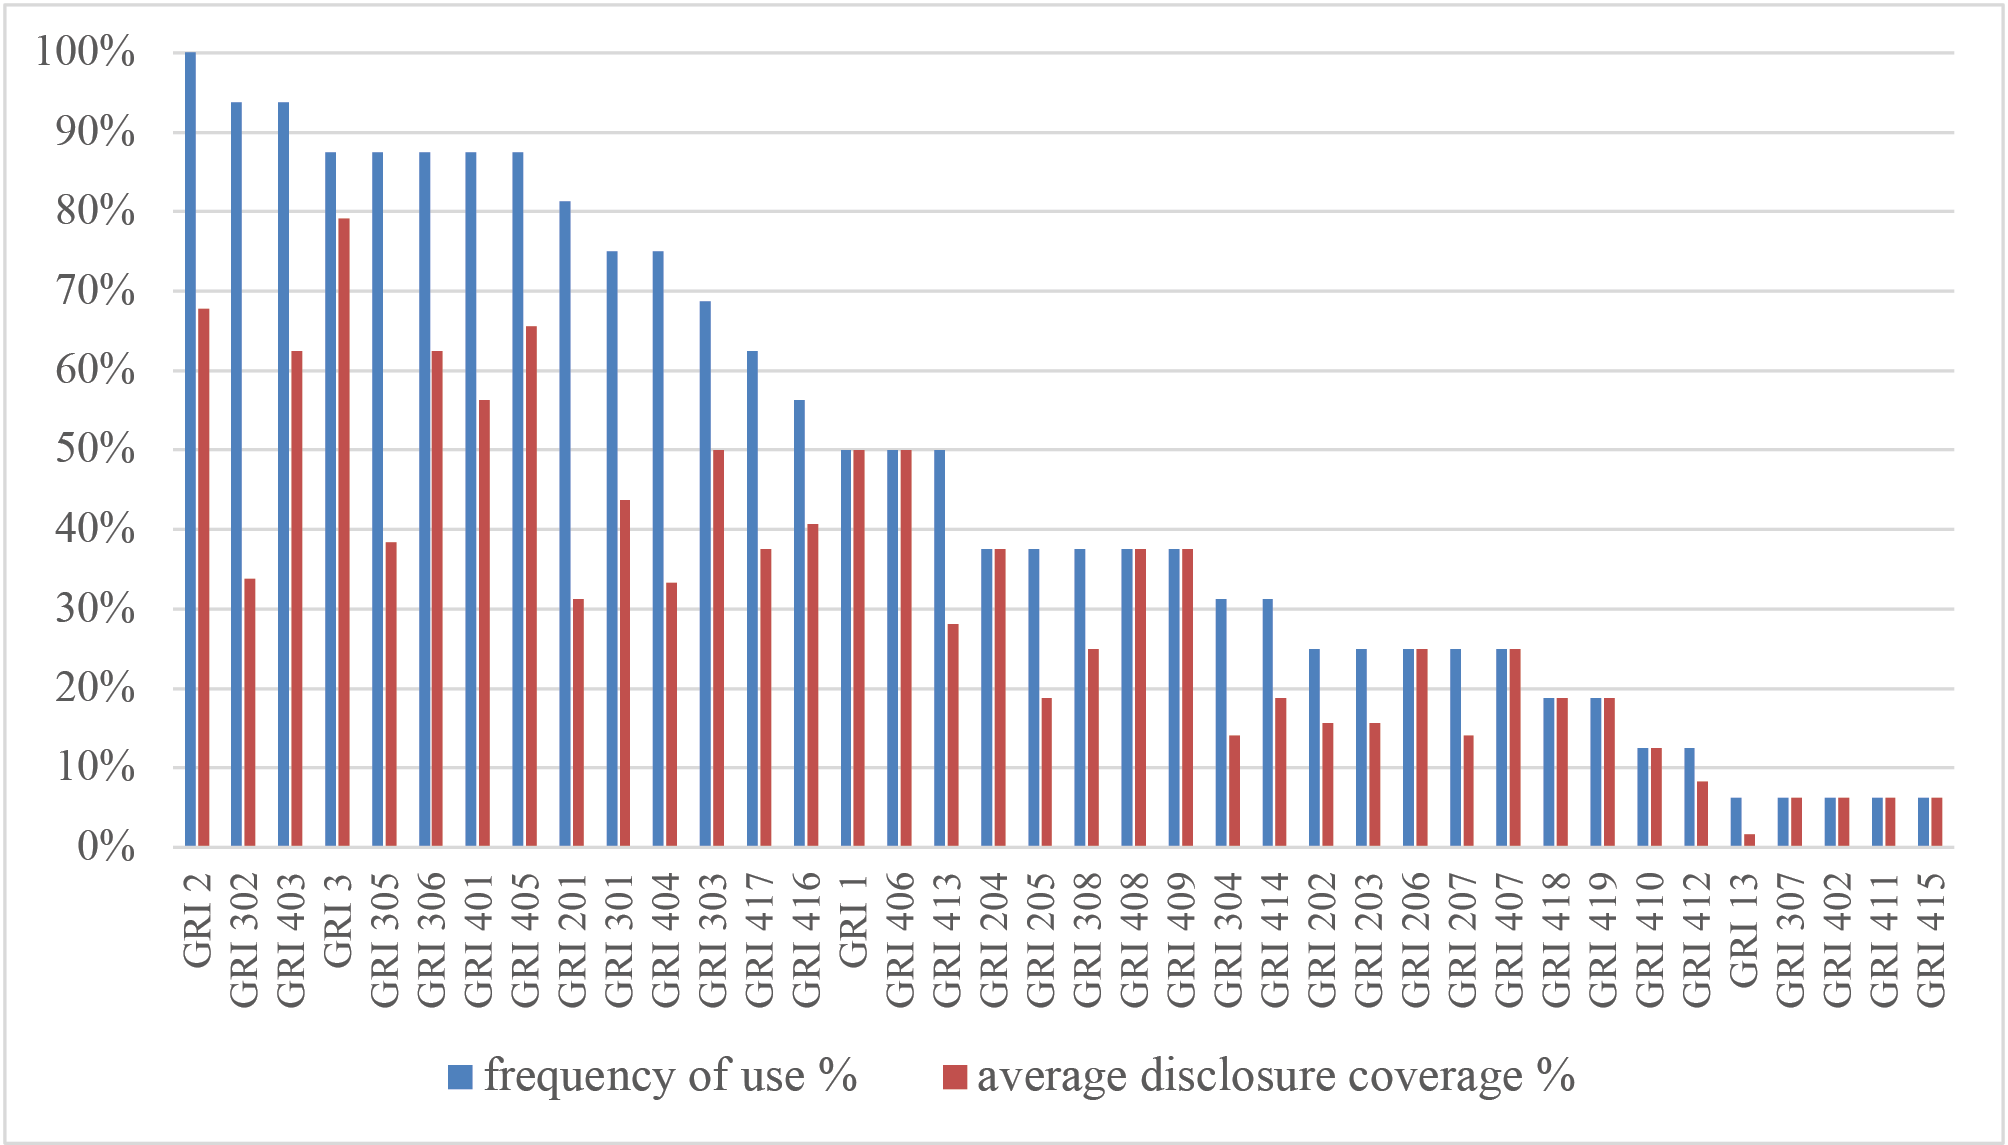
Specifically, GRI Universal Standards 1, 2, and 3 are not always reported by the sample, except for GRI 2 (100% frequency of use), even though their consultation represents the first step in the proper application of the GRI framework. In particular, the frequency of use and disclosure coverage of GRI 1 (50% for each) are not considered entirely reliable because GRI 1 does not indicate the information to be reported, but only the general principles at the head of the GRI framework (GRI, 2024). GRI 2, meanwhile, focuses on the chosen reporting practices of the business and its internal organisational policies and governance (GRI, 2024). All SMEs (100%) report it, covering on average 68% of their disclosures. On the one hand, information related to internal governance (i.e., the election of boards of directors, responsibility, performance evaluation, and remuneration) and internal policies for the management and mitigation of impacts generated are discussed less often. On the other hand, general information on the period of reporting, employees, organisational details, and sustainable development strategies are widely declared. Finally, GRI 3 has an 88% frequency of use and an average disclosure coverage of 79%. The disclosure reported least often is the ‘management of material topics’.
Regarding the GRI Specific Standards used, there is some correspondence with the material topics chosen. Indeed, the most used Specific Standards (with a ≥ 50% frequency of use) are GRI 403 (occupational health and safety), GRI 401 (employment), GRI 405 (diversity and equal opportunity), GRI 404 (training and education), GRI 417 (marketing and labelling), GRI 416 (customer health and safety), GRI 406 (no discrimination), and GRI 413 (local communities) in the social area; GRI 302 (energy), GRI 305 (emissions), GRI 306 (waste), GRI 301 (materials), and GRI 303 (water and effluents) in the environmental area; and GRI 201 (economic performance) in the economic area.
In general, there is a significant disparity in usage across different standards. For instance, only one business explicitly refers to GRI 13, indicating its limited adoption. Economic standards (the 200 series) are notably underrepresented, while environmental and social standards are more commonly addressed. Despite high usage rates for some standards, the actual coverage of disclosures varies widely, indicating the issues SMEs have in covering all of the information required.
Regarding the frequently used social standards, GRI 403 (occupational health and safety) shows the highest frequency of use (94%) and disclosure coverage of 63%, mainly regarding health and safety management systems, the identification of hazards and risks, accident assessment, and work-related injuries. GRI 401 (employment) and GRI 405 (diversity and equal opportunity) each have a frequency of use of 88% and disclosure coverage of 56% and 66%, respectively. The former mainly regards the characteristics and diversity of governance bodies and employers in terms of gender, age, and hiring and turnover rates. However, information is lacking on parental leave rules for GRI 401 and on remuneration diversity between women and men for GRI 405. Finally, GRI 404 (training and education) has a frequency of use of 75% but low disclosure coverage (33%). In fact, apart from the average yearly hours of training provided to employees, information on employee skills upgrading programmes and the evaluation of performance and career development is missing.
In the environmental area, GRI 302 (energy) has the highest frequency of use (94%), but a disclosure coverage of 34%. The main information for this standard concerns energy consumption and intensity internal to the business, while information is missing on outside consumption and reductions in consumption and the energy requirements of outputs. GRI 305 (emissions) has a frequency of use of 88%, but a relatively low disclosure coverage (38%). Again, disclosures regarding outside emissions indirectly affected by the business (Scope 3) and reductions are missing. Moreover, GRI 306 (waste) shows a high frequency of use (88%) and reasonable disclosure coverage of 63%. Finally, GRI 301 (materials) also exhibits a notable frequency of use (75%) but disclosure coverage of 44%. There is a lack of information on every disclosure, particularly on the recovery rates of product packaging materials, as well as the percentage of recycled materials used in production, highlighting a gap in communicating real sustainability practices.
Within the economic area, GRI 201 has a high frequency of use (81%), but disclosure coverage of only 31%. The focus is on financial implications and risks and opportunities related to climate change, benefits and pension plans, and governmental financial assistance received. All the other GRI Specific Standards on economic issues (the 200 series) show a frequency of use of less than 38%.
4.3. Potential adoption of the VSME for agrifood SMEs
To better understand how the subsample of 16 SMEs (out of 204) describes their actions in relation to specific topics for the food system, the correspondence between ESRS disclosures requested in the VSME set and the GRI standards used by the sample was determined (Table 3).
| VSME standard | VSME indicator | GRI standard and disclosure* | Content of the GRI disclosure | % sample adopting the GRI disclosure |
|---|---|---|---|---|
| Environmental | ||||
| B3 – Energy and greenhouse gas emissions | Total energy consumption in MWh (fossil fuels) broken down into: - total - renewable sources - non-renewable sources |
302_1a 302_1b |
Total fuel consumption within the organisation from renewable and non-renewable sources (in GJ or Wh and multiples) | 93.8 |
| Total energy consumption in MWh (electricity expressed in utility bills) broken down into: - total - renewable sources - non-renewable sources |
302_1e | Total energy consumption within the organisation (in GJ or multiples) | 93.8 | |
| Scope 1 (from owned or controlled sources) in tCO2eq: GHG Emissions, Fuel = Activity Data Fuel × EFGHG, Fuel × GWPGHG |
305_1a | Gross direct (Scope 1) GHG emissions in metric tons of CO2 equivalent | 87.5 | |
| Scope 2 (location-based) in tCO2eq: GHG Emissions = Activity Data × EF |
305_2a | Gross location-based energy indirect (Scope 2) GHG emissions in metric tons of CO2 equivalent | 81.3 | |
| Total GHG Emissions: Scope 1 + Scope 2 | 305_1a 305_2a |
Total GHG emissions (Scope 1 + Scope 2 Location Based) in metric tons of CO2 equivalent | 87.5 81.3 |
|
| GHG intensity: (Total Scope 1 + Scope 2)/turnover | 305_4a, b, c | a) GHG emissions intensity ratio for the organisation b) Organisation-specific metric (the denominator) chosen to calculate the ratio c) Types of GHG emissions included in the intensity ratio; whether direct (Scope 1), energy indirect (Scope 2), and/or other indirect (Scope 3) |
31.3 | |
| B4 – Pollution of air, water and soil | Amount of pollutants emitted in undertaking’s own operations in water (kg of emissions) |
- | GRI does not provide a direct match | - |
| Amount of pollutants emitted in undertaking’s own operations in soil (kg of emissions) |
- | GRI does not provide a direct match | - | |
| Amount of pollutants emitted in undertaking’s own operations in air (kg of emissions) |
305_7a | Significant air emissions, in kilograms or multiples, for each of the following: NOx, SOx, POP, VOC, HAP, PM, and others | 25.0 | |
| B5 – Biodiversity | Number and area (in hectares) of sites that the undertaking owns, has leased, or manages in or near Biodiversity Sensitive Areas (BSA) | 304_1a | Operational sites owned, leased, managed in, or adjacent to, protected areas and areas of high biodiversity value outside protected areas | 18.8 |
| Total use of land (in hectares or m2): - previous year - reporting year - % change |
304_1 | GRI does not provide a direct match; in the notes to 304-1 it is only suggested as a valid support | 18.8 | |
| Total sealed area (in hectares or m2): - previous year - reporting year - % change |
- | GRI does not provide a direct match | - | |
| Total nature-oriented area on-site (in hectares or m2): - previous year - reporting year - % change |
- | GRI does not provide a direct match | - | |
| Total nature-oriented area off-site (in hectares or m2): - previous year - reporting year - % change |
- | GRI does not provide a direct match | - | |
| B6 – Water | Total Water Withdrawal = ∑ of any withdrawal sources (public water as in utility bills + groundwater from own well + water from rivers and lakes + other sources – rainwater collected or stored) | 303_3a | Total water withdrawal from all areas in megalitres | 68.8 |
| Water Consumption = Water Withdrawal – Water discharges | 303_5a | Total water consumption from all areas in megalitres | 37.5 | |
| B7 – Resource use, circular economy, and waste management | Total annual generation of waste expressed in units of weight (kg or t) diverted to recycling or reuse and per type: - hazardous - non-hazardous |
306_3a | Total weight of waste generated in metric tons, and a breakdown of this total by composition of the waste |
81.3 |
| 306_4a, b, c | a) Total weight of waste diverted from disposal in metric tons, and a breakdown of this total by composition of the waste. b-c) Total weight of hazardous and non-hazardous waste diverted from disposal in metric tons, and a breakdown of this total by the following recovery operations: i. Preparation for reuse; ii. Recycling; iii. Other recovery operations |
56.3 | ||
| Annual mass-flow of relevant materials used (if the undertaking belongs to a sector using significant material flows – e.g., used lubricants and oils classified as hazardous) | EMAS certification | GRI does not provide a direct match but suggests covering this information with EMAS certification if held | - | |
| Social | ||||
| B8 – Workforce – general characteristics | a) Total number of employees (by full time equivalent or head count) by type of employment contract (temporary or permanent) | 2_7b | Total number of employees by type of employment contract, broken down by gender and region | 93.8 |
| b) Total number of employees (by full time equivalent or head count) by gender; | 2_7a | Total number of employees, broken down by gender and by region | 93.8 | |
| 405_1b | Percentage of employees per employee category in each of the following diversity categories: gender; age group; and other indicators of diversity where relevant | 87.5 | ||
| c) Total number of employees (by full time equivalent or head count) by country of the employment contract (if applicable) | 2_7b | c) Total number of employees (by full time equivalent or head count) by country | 93.8 | |
| Employee turnover (when ≥ 50 employees): (number of employees who left during reporting year / Average number of employees during reporting year) × 100 | 401_1b | Total number of employee turnover during the reporting period, by age group, gender and region. | 87.5 | |
| B9 – Workforce – health and safety | Number of recordable work-related accidents and Rate = (number of accidents in the reporting year / total number of hours worked by all employees in a year) × 200 | 403_9a.ii-v | Number of work-related injuries | 93.8 |
| Number of fatalities as a result of work-related injuries and work-related ill health | 403_9a.i | The number and rate of fatalities as a result of work-related injury | 93.8 | |
| B10 – Workforce – remuneration, collective bargaining, and training | a) Minimum wage: verification that employees pay is ≥ minimum wage (determined directly by the national minimum wage law or through a collective bargaining agreement) |
202_1a, b, c | Ratios of standard entry level wage by gender compared to the local minimum wage | 6.3 |
| b) Gender pay gap (when at least 150 employees) = [(average gross hourly pay of male employees – average gross hourly pay of female employees)/ average gross hourly pay of male employees] × 100 | 405_2a | Ratio of the basic salary and remuneration of women to men for each employee category, by significant locations of operation |
43.8 | |
| c) % of collective bargaining coverage = (number of employees covered by collective bargaining agreements / number of employees) × 100 | 2_30a | Report the percentage of total employees covered by collective bargaining agreements | 75.0 | |
| d) Average number of annual training hours per employee broken down by gender | 404_1a | Average hours of training that the organisation’s employees have undertaken during the reporting period, by: gender; employee category | 75.0 | |
| Business conduct | ||||
| B11 – Convictions and fines for corruption and bribery | Number of convictions (verdict of criminal court) incurred for the violation of anti-corruption and anti-bribery laws | 2_27a | Report the total number of significant instances of non-compliance with laws and regulations during the reporting period | 56.3 |
| Total amount of fines (monetary penalties) incurred for the violation of anti-corruption and anti-bribery laws | 2_27b | Report the total number and the monetary value of fines for instances of non-compliance with laws and regulations that were paid during the reporting period | 56.3 | |
Within the social dimension, the VSME set identifies three aspects: general characteristics (B8); health and safety (B9); and remuneration, collective bargaining, and training (B10). The first two aspects are comprehensively covered by GRI 2, 403, and 405 and widely and consistently reported by the sample, with a frequency of use ranging from 87.5% to 93.8%. In contrast, reporting on B10 shows greater variability. Specifically, disclosures on minimum wage (GRI 202) are minimal (6.3%), while the gender pay gap (GRI 405) is reported by 43.8% of the sample. Coverage for collective bargaining (GRI 2) and annual training hours (GRI 404) reaches 75%. These findings align with the material topics prioritised by businesses, which demonstrate strong engagement with occupational health and safety and broader employment practices. Notably, other socially relevant topics – such as training and education, consumer communication on product quality, and local community support – are addressed by over 50% of the sample via GRI standards that are absent from the VSME set.
Analysis of environmental disclosures indicates high coverage for energy use and greenhouse gas (GHG) (B3), with 81.3% to 93.8% of the sample reporting on these topics. Exceptions include GHG intensity indicators, reported by only 31.3% of SMEs. Pollution of air, water, and soil (B4) is less consistently covered, as GRI standards do not fully encompass water and soil pollution. Air emissions are addressed under GRI 305, but only 25% of SMEs report this information. Biodiversity (B5) presents further challenges, with GRI 304 capturing only the number and area of sites near or within Biodiversity Sensitive Areas; this is reported by 18.8% of the sample. Water-related disclosures (B6) under GRI 303 show more frequent reporting of general water withdrawal (68.8%) than water consumption and discharge (37.5%). Resource use, circular economy, and waste management (B7) exceed 50% reporting for total waste generation, waste diverted from disposal, and hazardous versus non-hazardous waste, as captured by GRI 306. It is also notable that materials – a topic of high interest and disclosure capacity for SMEs through GRI – are not included in the VSME set.
Regarding governance, convictions and fines for corruption and bribery (B11), reported under GRI 2, appear in 56.3% of the sample. From an economic perspective, SMEs demonstrate strong engagement with value creation as a material topic through GRI disclosures, although this area is not included in the VSME set.
5. Discussion
The scarcity of companies adopting a GRI-based reporting system compared to the number of companies analysed indicates the difficulty or lack of interest of agrifood SMEs in adhering to this practice, as highlighted in the literature (Del Baldo, 2017; Girella et al., 2019; Rodríguez-Gutiérrez et al., 2021; Giarratana, 2023; Marconati, 2024; Tombolesi, 2024; Briamonte, Scarpato, 2025). However, the growing institutional pressure to draw up sustainability reports requires reflection on the usefulness of this tool for agrifood SMEs. The trend observed at the institutional level is leading to greater simplification of the reporting frameworks to facilitate the use of shared standards. However, this process cannot ignore two important aspects: first, the need for specific indicators for the agrifood sector, which are currently scarce, and second, the impact that a business can have on the entire agrifood system.
Concerning the first aspect, the VSME lack indicators on social aspects that assess the impact on the local community and other elements that characterise product quality which agrifood SMEs are generally capable of and interested in communicating (Briamonte, Hinna, 2008). Indeed, the analysis confirms that businesses adopt the GRI standards to highlight their impact on the local community, disclosing, for example, the launch of educational initiatives, collaboration with charitable organisations and local associations, and the inclusion of disadvantaged people. Meanwhile, SMEs also provide information on product quality, including the adoption of transparent labelling in terms of materials used, information on product characteristics and consumption, and certifications in compliance with European regulations. Moreover, the GRI and VSME frameworks demonstrate limited attention to sustainable practices geared towards preserving biodiversity, soil health, and pesticide use, which, in turn, are key to the agrifood sector’s ability to achieve Sustainable Development Goal (SDG) 15 (Life on Land) and SDG 12 (Sustainable Practices). The businesses do present some qualitative indicators on sustainable agricultural practices to preserve or promote biodiversity in their reports, albeit to a limited extent. The lack of coverage of this critical topic could be due to the actual lack of interest of businesses in the issues or related to an inability to find suitable indicators to produce communicable information. Indeed, it can be argued that it is inherently difficult to quantify and measure the impact of agricultural materials on biodiversity. The available indicators are often closely linked to subjective assumptions and do not consider complex dynamics such as the comparison of on-farm versus off-farm impacts on biodiversity (Wesseler, 2022). Other potential indicators to assess the biodiversity of a habitat, proposed in the academic literature, are the QBS-ar method (Biological Soil Quality) based on the soil micro-arthropod community analysis (Parisi, 2001; Parisi et al., 2005) and the Shannon diversity index, a statistical measure quantifying the biodiversity of a habitat (Kok et al., 2020; Shannon, Weaver, 1949 in Dabkiene et al., 2021). The GRI itself has updated its Biodiversity Standard to the new GRI 101, which will be in force beginning in January 2026. This requires businesses to determine the sites, products, and services in their supply chain that have the most significant impacts on biodiversity, both in terms of protection and loss, and their evolution over time with a clear value chain perspective. This new approach also requires businesses to report on the potential or actual biodiversity impacts of upstream and, if desired, downstream suppliers, and on the effects of the business’s activities on local communities and other stakeholders (GRI, 2025b).
The second aspect is related to the lack of supply chain impact assessments, which highlights the fact that businesses have poor awareness of their responsibility to influence the sustainability of the entire supply chain in which they operate. Considering the upstream level, businesses infrequently disclose the evaluations of suppliers and report only on material usage. Concerning the downstream level, reporting is focused on ‘food safety’ information for the consumer. Although a comprehensive supply chain perspective is crucial for achieving a positive sustainability impact, it is not required in the VSME. Despite their small size, SMEs have a significant impact on the environmental, social, and economic sustainability of food supply chains due to their prevalence, widespread distribution, and key role along the entire value chain (Schmerber et al., 2022; UN Global Compact, 2024). The EFRAG has proposed an Implementation Guidance draft specific to reporting the impact on the value chain. First, this guidance considers the value chain as a whole, defined as the entire supply chain and all its interactions with the external environment, including resources, activities, and human relations, from the upstream to downstream levels. Second, it provides instructions on how businesses should report on how they impact the value chain. These initial implementation steps demonstrate the increasing focus on the concept of value chain impact that the future ESRS intend to incorporate, which will also increasingly engage SMEs (EFRAG, 2023a). Therefore, it also emphasises the need for future advances in reporting this type of impact.
Considering these aspects, the analysis conducted in this study raises questions about the meaning of reporting: is it intended to be a tool that represents minimum standards to be achieved or a strategic tool with multiple objectives for driving the sustainable transition? In the latter case, reporting can be useful (i) to monitor corporate performance in terms of sustainability, which SMEs lack; (ii) to access financial or credit benefits; (iii) to demonstrate a company’s ability to produce positive externalities in line with the SDGs; and (iv) to create a reputational return on image that increases the perceived value of products. While the first three aspects can bring more immediate results in the short term, the fourth requires more time and the ability to communicate with civil society (Casalino, 2024). Consequently, the tool must be easy to complete, covering aspects relevant to the agrifood system and its key stakeholders, and be clearly communicated externally.
6. Conclusions
This study conducted a comparative analysis between the GRI and VSME reporting frameworks, analysing the applicability of the VSME for agrifood SMEs. Content analysis was used to examine the sustainability reports of 16 Italian agrifood SMEs to determine the use of the GRI standards and the ability to adopt the VSME. Sustainability reporting can represent an innovative tool for assessing the sustainable practices of businesses and acquiring benefits in terms of reputational and financial returns. However, the results show that although the latest VSME framework reduces complexity and resource requirements compared to the GRI, it still lacks sector-specific indicators for the agrifood industry as well as a value chain perspective. These gaps limit the potential efficacy of sustainability reporting practices for agrifood SMEs. Furthermore, because the adoption of these reporting frameworks requires significant economic investment by SMEs, it is important that agrifood SMEs perceive sustainability reporting as a useful tool, and not just a compliance exercise. In fact, sustainability reporting can be a management tool to support decision-making processes and a commitment to sustainability transitions.
Considering the missing disclosures in the VSME and the difficulties SMEs face in collecting data and reporting certain indicators, the VSME can be considered a starting point rather than a definitive solution. In this sense, the development of a reporting framework tailored to the agrifood sector and the capabilities of SMEs should be considered an evolving work in progress. Associations and intermediary bodies could be involved as consultants (i.e., Tombolesi, 2024) or facilitators between the business and its stakeholders, to understand the interests of the stakeholders and to support the drafting of the report and the communication of the company’s activities. A valuable example is Confcooperative Parma (Emilia-Romagna), which has established the external ‘Omnia Service’ office to provide specific services for their associates, such as support in the transition towards and reporting on sustainability. At the same time, they work as intermediaries between businesses and financial institutions to achieve financial benefits. Continuous refinement and dialogue between policymakers, standard-setting bodies, intermediary institutions, and businesses could be key to creating a reporting system that is feasible for SMEs and capable of promoting a meaningful transition towards sustainability in the agrifood sector.
Acknowledgements and Funding
This work was supported by the National Recovery and Resilience Plan (NRRP), Mission 4 Component 2 Investment 1.3 - Call for tender No. 341 of 15 March 2022 of Italian Ministry of University and Research funded by the European Union – NextGenerationEU Project code PE00000003, Concession Decree No. 1550 of 11 October 2022 adopted by the Italian Ministry of University and Research, CUP D93C22000890001, Project title “ON Foods - Research and innovation network on food and nutrition Sustainability, Safety and Security – Working ON Foods”.
Author contributions
Conceptualization, T.T., M.G. and F.A.; Methodology, T.T. and M.G.; Investigation, T.T. and M.G.; Writing - Original Draft, T.T. and M.G.; Writing –Review & Editing, T.T., M.G. and F.A.; Funding Acquisition, F.A.; Resources, F.A.; Supervision, F.A.
References
Arena M., Azzone G. (2012). A process-based operational framework for sustainability reporting in SMEs. Journal of Small Business and Enterprise Development, 19(4): 669-686. DOI: https://doi.org/10.1108/14626001211277460.
Arkoh P., Costantini A., Scarpa F. (2023). Determinants of sustainability reporting: A systematic literature review. Corporate Social Responsibility and Environmental Management, 31(3): 1578-1597. DOI: https://doi.org/10.1002/csr.2645.
Bartolacci F., Caputo A., Soverchia M. (2020). Sustainability and financial performance of small and medium sized enterprises: A bibliometric and systematic literature review. Business Strategy and the Environment, 29(3): 1297-1309. DOI: https://doi.org/10.1002/bse.2434.
Baumüller J., Grbenic S.O. (2021). Moving from non-financial to sustainability reporting: Analyzing the EU Commission’s proposal for a Corporate Sustainability Reporting Directive (CSRD). Facta Universitatis, Series: Economics and Organization, (1): 369-381. DOI: https://doi.org/10.22190/FUEO210817026B.
Bellantuono N., Pontrandolfo P., Scozzi B. (2018). Guiding materiality analysis for sustainability reporting: the case of agri-food sector. International Journal of Technology, Policy and Management, 18(4): 336-359. DOI: https://doi.org/10.1504/IJTPM.2018.096181.
Briamonte L., Hinna L. (2008). La responsabilità sociale per le imprese del settore agricolo e agroalimentare. Edizioni Scientifiche Italiane, Napoli.
Briamonte L., Scarpato D. (2025). From soft law to hard law: Legal transitions and sustainable challenges in the Italian agri-food sector. Sustainability, 17(19), 8952. DOI: https://doi.org/10.3390/su17198952.
Briamonte L., Pergamo R., Salerno C., Uliano A., Nazzaro C. (2024). Measuring social sustainability in the Italian agri-food sector: Proposed key performance indicators. Foods, 13(17), 2849. DOI: https://doi.org/10.3390/foods13172849.
Calabrese A., Costa R., Levialdi Ghiron N., Menichini T. (2019). Materiality analysis in Sustainability Reporting: A tool for directing corporate sustainability towards emerging economic, environmental and social opportunities. Technological and Economic Development of Economy, 25(5): 1016-1038. DOI: https://doi.org/10.3846/tede.2019.10550.
Casalino M.V. (2024). La pianificazione strategica della sostenibilità alla luce della Direttiva n. 2022/2464 Corporate Sustainability Reporting Directive, Tesi di Laurea Magistrale in Amministrazione, Finanza e Controllo, Università Ca’ Foscari di Venezia.
Castillo-Diaz F.J., Belmonte-Urena L.J., Lopez-Serrano M.J., Camacho-Ferre F. (2023). Assessment of the sustainability of the European agri-food sector in the context of the circular economy. Sustainable Production and Consumption, 40: 398-411. DOI: https://doi.org/10.1016/j.spc.2023.07.010.
Celli M., Arduini S., Beck T. (2024). Corporate sustainability reporting directive (CSRD) and his future application scenario for Italian SMEs. International Journal of Business and Management, 19(4): 1-44. DOI: https://doi.org/10.5539/ijbm.v19n4p44.
Confindustria, Cerved (2023). Rapporto regionale PMI 2023, Report 2023, Confindustria and Cerved, Roma.
CONSOB (2025). SMEs – Small and medium-sized enterprises, Commissione Nazionale per le Società e la Borsa, Rome. https://www.consob.it/web/consob-and-its-activities/smes.
Corriere della Sera (2022). Bilancio di sostenibilità: ecco le aziende che si raccontano meglio, Corriere della Sera, Milan. http://www.corriere.it/buone-notizie/22_aprile_11/bilancio-sostenibilita-ecco-aziende-che-si-raccontano-meglio-d1b8620c-b6c1-11ec-b39d-8a197cc9b19a.shtml.
Dabkiene V., Balezentis T., Streimikiene D. (2021). Development of agri-environmental footprint indicator using the FADN data: Tracking development of sustainable agricultural development in Eastern Europe. Sustainable Production and Consumption, 27: 2121-2133. DOI: https://doi.org/10.1016/j.spc.2021.05.017.
Deegan C., Gordon B. (1996). A study of the environmental disclosure policies of Australian corporations. Accounting and Business Research, 26(3): 187-199. DOI: https://doi.org/10.1080/00014788.1996.9729510.
Deegan C., Rankin M. (1996). Do Australian companies report environmental news objectively? An analysis of environmental disclosures by firms prosecuted successfully by the Environmental Protection Authority. Accounting, Auditing and Accountability Journal, 9(2): 50-67. DOI: https://doi.org/10.1108/09513579610116358.
Del Baldo M. (2017). The implementation of integrating reporting in SMEs: Insights from a pioneering experience in Italy. Meditari Accountancy Research, 25(4): 505-532. DOI: https://doi.org/10.1108/MEDAR-11-2016-0094.
Donnari A. (2023). Il report di sostenibilità nelle PMI: un’indagine sul livello preliminare di allineamento ai nuovi standard VSME-ESRS, Tesi di Laurea Magistrale in Economia e Management, Università Politecnica delle Marche.
EEA (2024). Trends and projections in Europe 2024, Report n. 11, European Environment Agency, Copenhagen. DOI: https://doi.org/10.2800/7574066.
EFRAG (2023a). Draft EFRAG IG 2: Value chain implementation guidance, European Financial Reporting Advisory Group, Brussels.
EFRAG (2023b). Draft EFRAG IG 3 List of ESRS Data Points, European Financial Reporting Advisory Group, Brussels.
EFRAG (2024). EFRAG Voluntary Sustainability Reporting Standard for non-listed SMEs (VSME), European Financial Reporting Advisory Group, Brussels.
EFRAG (2025a). SMEs, European Financial Reporting Advisory Group, Brussels. https://www.efrag.org/en/sustainability-reporting/esrs-workstreams/smes.
EFRAG (2025b). Interoperability, European Financial Reporting Advisory Group, Brussels. https://www.efrag.org/en/sustainability-reporting/esrs-workstreams/interoperability.
Elalfy A., Weber O., Geobey S. (2021). The Sustainable Development Goals (SDGs): A rising tide lifts all boats? Global reporting implications in a post SDGs world. Journal of Applied Accounting Research, 22(3): 557-575. DOI: https://doi.org/10.1108/JAAR-06-2020-0116.
European Commission. (2020). Farm to Fork Strategy: For a fair, healthy and environmentally-friendly food system. COM/2020/381, Brussels.
FoodDrinkEurope (2024). Data & Trends: EU Food and Drink Industry, 2024 Edition, FoodDrinkEurope, Brussels. https://www.fooddrinkeurope.eu/wp-content/uploads/2025/01/FoodDrinkEurope-Data-Trends-2024.pdf.
Fornasari T., Traversi M. (2024). The impact of the CSRD and the ESRS on non-financial disclosure. Symphonya. Emerging Issues in Management, (1): 117-133. DOI: https://doi.org/10.4468/2024.1.07fornasari.traversi.
Giarratana E. (2023). L’evoluzione della reportistica di sostenibilità: nuove sfide per le PMI, Tesi di Laurea Magistrale in Economia e Legislazione d’Impresa, Università di Pavia.
Girella L., Zambon S., Rossi P. (2019). Reporting on sustainable development: A comparison of three Italian small and medium-sized enterprises. Corporate Social Responsibility and Environmental Management, 26(4): 981-996. DOI: https://doi.org/10.1002/csr.1738.
GRI (2022). The materiality madness: Why definitions matter, The GRI Perspective, 3: 1-4.
GRI (2023a). GRI 13: Agriculture, Aquaculture and Fishing Sectors 2022 - Sector Standard, Global Reporting Initiative, Amsterdam.
GRI (2023b). ESRS-GRI Standards data point mapping, Global Reporting Initiative, Amsterdam. https://www.globalreporting.org/media/muajmnbl/draft-esrs-gri-standards-data-point-mapping.xlsx.
GRI (2024). Consolidated set of the GRI Standards, Global Reporting Initiative, Amsterdam.
GRI (2025a). Vision, mission and history. Global Reporting Initiative, Amsterdam.
GRI (2025b). GRI 101: Biodiversity 2024 - Topic Standard, Global Reporting Initiative, Amsterdam.
GRI (n.d.). A short introduction to the GRI Standards, Global Reporting Initiative, Amsterdam.
GRI, EFRAG (2023). [draft] GRI-ESRS Interoperability Index, Global Reporting Initiative and European Financial Reporting Advisory Group, Amsterdam. https://www.efrag.org/en/sustainability-reporting/esrs-workstreams/interoperability.
Guthrie J., Abeysekera I. (2006). Content analysis of social, environmental reporting: What is new? Journal of Human Resource Costing and Accounting, 10(2): 114-126. DOI: https://doi.org/10.1108/14013380610703120.
Guthrie J., Parker L.D. (1990). Corporate social disclosure practice: A comparative international analysis. Advances in Public Interest Accounting, 3: 159-175.
Kok A., De Olde E.M., De Boer I.J.M., Ripoll-Bosch R. (2020). European biodiversity assessments in livestock science: A review of research characteristics and indicators. Ecological Indicators, 112, 105902. DOI: https://doi.org/10.1016/j.ecolind.2019.105902.
Leardini A. C., Serventi S. (2016). The cultural landscape of food: The infrastructure resilience of Via Emilia. In Roggema R. (eds) Sustainable Urban Agriculture and Food Planning (pp. 38-52). Routledge, London. DOI: https://doi.org/10.4324/9781315646039.
Marconati L. (2024). PMI e rendicontazione di sostenibilità: Analisi del quadro normativo e del contesto di applicazione, Tesi di Laurea Magistrale in Economia e Gestione delle Aziende, Università Ca’ Foscari di Venezia.
Massari G.F., Giannoccaro I. (2023). Adopting GRI standards for the circular economy strategies disclosure: The case of Italy. Sustainability Accounting, Management and Policy Journal, 14(4): 660-694. DOI: https://doi.org/10.1108/SAMPJ-07-2021-0284.
Myers S.S., Smith M.R., Guth S., Golden C.D., Vaitla B., Mueller N.D., Dangour A.D., Huybers P. (2017). Climate change and global food systems: Potential impacts on food security and undernutrition. Annual Review of Public Health, 38(1): 259-277. DOI: https://doi.org/10.1146/annurev-publhealth-031816-044356.
Ortiz-Martínez E., Marín-Hernández S. (2023). Sustainability information in European small- and medium-sized enterprises. Journal of the Knowledge Economy, 15: 7497-7522. DOI: https://doi.org/10.1007/s13132-023-01386-7.
Parisi V. (2001). The biological soil quality, a method based on microarthropods. Acta Naturalia de L’Ateneo Parmense, 37: 97-106.
Parisi V., Menta C., Gardi C., Jacomini C., Mozzanica E. (2005). Microarthropod communities as a tool to assess soil quality and biodiversity: A new approach in Italy. Agriculture, Ecosystems & Environment, 105(1-2): 323-333. DOI: https://doi.org/10.1016/j.agee.2004.02.002.
Regione Emilia-Romagna (2024). Il sistema agro-alimentare dell’Emilia-Romagna: Rapporto 2023, Report 2023, Regione Emilia-Romagna and Unioncamere Emilia-Romagna and ART-ER, Bologna.
Rodríguez-Gutiérrez P., Guerrero-Baena M. D., Luque-Vílchez M., Castilla-Polo F. (2021). An approach to using the best-worst method for supporting sustainability reporting decision-making in SMEs. Journal of Environmental Planning and Management, 64(14): 2618-2640. DOI: https://doi.org/10.1080/09640568.2021.1876003.
SACE (2024). SACE Sector Kit 2024: The food and beverage industry in Italy, SACE, Rome.
Schmerber L., Tõnnisson R., Veliste M. (2022). Supporting the agrifood sector. A policy brief from the policy learning platform on SME competitiveness. Interreg Europe, Lille.
Steinhöfel E., Galeitzke M., Kohl H., Orth R. (2019). Sustainability reporting in German manufacturing SMEs. Procedia Manufacturing, 33: 610-617. DOI: https://doi.org/10.1016/j.promfg.2019.04.076.
Stranieri S., Orsi L., Banterle A., Ricci E.C. (2019). Sustainable development and supply chain coordination: The impact of corporate social responsibility rules in the European Union food industry. Corporate Social Responsibility and Environmental Management, 26(2): 481-491. DOI: https://doi.org/10.1002/csr.1698.
Tombolesi R. (2024). Performance di sostenibilità e fattori ESG. Una nuova opportunità per le PMI italiane. Quaderni di ricerca sull’artigianato, 12(2): 193-204.
Topp-Becker J., Ellis J.D. (2017). The role of sustainability reporting in the agri-food supply chain. Journal of Agriculture and Environmental Sciences, 6(1): 17-29. DOI: https://doi.org/10.15640/jaes.v6n1a2.
Torelli R., Balluchi F., Furlotti K. (2020). The materiality assessment and stakeholder engagement: A content analysis of sustainability reports. Corporate Social Responsibility and Environmental Management, 27(2): 470-484. DOI: https://doi.org/10.1002/csr.1813.
Tubiello F.N., Karl K., Flammini A., Gütschow J., Obli-Laryea G., Conchedda G., Pan X., Yue Qi S., Halldórudóttir Heiðarsdóttir H., Wanner N., Quadrelli R., Rocha Souza L., Benoit P., Hayek M., Sandalow D., Mencos Contreras E., Rosenzweig C., Rosero Moncayo J., Conforti P., Torero M. (2022). Pre-and post-production processes increasingly dominate greenhouse gas emissions from agri-food systems. Earth System Science Data, 14(4): 1795-1809. DOI: https://doi.org/10.5194/essd-14-1795-2022.
UN Global Compact (2024). The unique role of SMEs and supply chains in charting a positive future, The Compact Journal, 03 February 2025.
Weber R.P. (1990). Basic Content Analysis. Sage, London.
Wesseler J. (2022). The EU’s farm-to-fork strategy: An assessment from the perspective of agricultural economics. Applied Economic Perspectives and Policy, 44(4): 1826-1843. DOI: https://doi.org/10.1002/aepp.13239.
Zharfpeykan R., Akroyd C. (2023). Evaluating the outcome effectiveness of the global reporting initiative transitions. Sustainability Accounting, Management and Policy Journal, 14(6): 1101-1125. DOI: https://doi.org/10.1108/SAMPJ-07-2022-0365.