https://doi.org/10.36253/rea-16629
Received: September 11, 2025; Revised: February 23, 2026; Accepted: March 04, 2026
Research article
Understanding how milk-producing countries estimate costs of dairy production: A comparative review
1 Faculty of Agricultural, Environmental and Food Sciences, Free University of Bozen-Bolzano, Italy
2 Departement of Livestock Socio-economics, Faculty of Animal Science, Universitas Gadjah Mada, Yogyakarta, Indonesia
3 Rector of the University of Veterinary Medicine, Vienna, Austria
*Corresponding authors. E-mail: atriatmojo@unibz.it; thomas.zanon@unibz.it
Abstract. Benchmarking milk cost of production (CoP) helps identify economic performance disparities, guide business decisions, and shape policy regulations across the dairy industry. However, the reliability of CoP data is heavily influenced by the methodologies employed. Comparisons remain challenging due to variations in farm business characteristics, accounting regulations, market dynamics, and political considerations. Therefore, this review aims to explore the diverse CoP methodologies to compare the cost frameworks and revenues of dairy enterprises in countries that are significant producers in the global market. The analysis includes countries from the EU27 (Germany, France, the Netherlands, Poland, Italy, and Ireland), along with the United States, Canada, Brazil, Australia, and New Zealand, in comparison with global dairy network benchmarks. The findings clearly demonstrate that methods for calculating milk CoP vary considerably among countries. In addition, discrepancies in CoP methods may distort the disparities in the economic performance of dairy operations. This study concludes that variations in cost frameworks across countries hinder effective cross-country comparisons of milk CoP, and that current harmonised frameworks provide decent estimations when compared to national calculations. To address this issue, it is recommended that global dairy networks develop harmonised methodologies that consider existing official national methods and local contexts, thereby enhancing policy relevance and improving comparison accuracy.
Keywords: dairy farming, milk price, milk production, production costs, Typical Farm Approach.
JEL codes: C81, Q12, Q14.
Contents
2. Data sources and methodologies
2.1. Data sources for global comparative analysis and harmonisation methods
2.2. Reporting practices and financial year considerations
2.3. Methods for allocating joint farm costs
2.4. Cost component categorisation
4. Estimation of milk CoP and revenue
4.1. Milk CoP framework and typologies
Overview of milk CoP frameworks
4.2. Proportional analysis of milk CoP components
4.3. Global variations in total milk CoP
4.4. Farm gate milk price comparisons
4.5. Quantitative insights into cost and revenue margin estimates
5. Discussion and concluding remarks
Highlights:
- –Key cost components, such as feed and labour, are defined differently in various countries.
- –Countries differ in including cattle sales and subsidies in milk cost of production calculations.
- –Low milk prices in most milk-producing countries fail to cover full production costs.
- –The Typical Farm Approach is a decent method but tends to underestimate the cost of production in pasture-based milk-producing countries.
1. Introduction
Cost of production (CoP) data provide valuable insights into the efficiency of agricultural production systems by illustrating the relationship between inputs and outputs (Hegazi, 2024). However, the reliability of CoP data is heavily influenced by the methodologies employed for its collection and interpretation (Langrell et al., 2012). Harmonising data from diverse sources into a unified database presents significant challenges, particularly in the absence of standardised international protocols (Hemme et al., 2014). A critical prerequisite for evaluating the suitability of existing CoP databases for comparative analysis is the understanding of the various methodologies and contexts across countries. Nations apply distinct methods to calculate CoP for agricultural commodities, yet the underlying principles remain consistent (Langrell et al., 2012). Although less globally tradable given the majority of global dairy products is consumed within the country of production (Ohlan, 2014), milk requires specialised CoP analysis due to the unique characteristics of the dairy industry. Milk production is regionally influenced by factors such as farm characteristics and management, feed resources, climate, and regulations (Britt et al., 2018; Stirm, St-Pierre, 2003), resulting in distinct cost structures. Unlike other commodities, the allocation of joint costs between livestock and crop enterprises, as well as between milk and beef production, further complicates cost calculations (Food and Agriculture Organisation of the United Nations [FAO], 2016; International Farm Comparison Network [IFCN] Dairy Network, 2022). In general, CoP methods are often influenced by political intentions (Belloin, 1998; Mykrantz, Bozic, 2022; Smith, 1974; Stanbury, 2002) and reflect national or organisational goals (Allain, Laurin, 2018; Quesado, Silva, 2021). Despite previous attempts to standardise methods at the regional level, substantial methodological differences persist, resulting in limited comparability of CoP data, even within geographically close regions. For example, the European Milk Board (EMB), a group of European dairy associations, has criticised the European Union (EU) Commission’s harmonised CoP methods, arguing that they fail to capture the diversity of dairy production systems across Europe (EMB, 2021). Hence, comparing milk CoP valuations across countries remains a complex challenge, requiring greater collaboration and consensus among stakeholders at both the regional and international levels.
Efforts to harmonise CoP methods could enhance the comparability and relevance of milk CoP data at the global level. The IFCN, a global dairy network, has made strides towards this goal by collaborating with research partners to analyse typical dairy farming systems and report international production costs. The IFCN’s methodology, however, lacks clarity in distinguishing between approaches. Previous research on milk CoP has focused on its unbiased measurements across countries (Belloin, 1998; Hemme et al., 2014) and the development of automated tool to efficiently benchmark dairy farms within countries (Freitas, Cabrera, 2025). While numerous scholars have broadly examined agricultural CoP (FAO, 2016; Langrell et al., 2012; Ronzon et al., 2014), these studies have not accounted for methodological differences specific to milk CoP. More specifically, three conceptual strategies have been proposed for global comparisons of CoP methods: (1) minimalistic harmonisation, which uses existing databases as-is to compare CoP data across nations with minimal adjustments; (2) partial harmonisation, advocating for a unified approach to data collection and CoP methods by governments; and (3) full harmonisation, aiming to establish global networks with standardised CoP methods and continuous refinement (Langrell et al., 2012).
Given the above background, this review aims to examine the differences and similarities in milk CoP calculations across selected countries, identifying the key national and international factors that influence these variations. While the primary focus is on CoP, farm revenue is also investigated to highlight disparities in economic performance. To achieve this, a minimalistic harmonisation strategy is first implemented using national-level databases for international comparisons, followed by a critical evaluation of a full harmonisation strategy based on current globally harmonised milk CoP methods. Then, economic performance is compared using two different conversion factors based solely on cost-revenue calculations. Finally, the implications of differing CoP methods on dairy trade policies are explored. This comprehensive approach may help identify fair comparisons, inform business decisions, and guide dairy trade policies.
2. Data sources and methodologies
2.1. Data sources for global comparative analysis and harmonisation methods
This review uses milk CoP data from multiple sources, as presented in Table 1. The inclusion of particular countries in this analysis is principally justified by their significant milk production volumes and the accessibility of comprehensive data relevant to the dairy industry under study. All datasets are made publicly available by government bodies, agricultural institutions, and dairy associations, thus ensuring a high level of transparency and reliability. For the sake of clarity, it is worth mentioning that differences in data collection, categorisation, and timeframes may affect the comparability of the data across countries. In addition, although these datasets are comprehensive, they vary in terms of representativeness: some of them cover a broad range of farms and others focus on specific regions or production systems.
| Country | Abbreviation | Sources |
|---|---|---|
| European Union | EU | Eurostat/ EU Commission |
| United States of America | US | United States Department of Agriculture (USDA) |
| Canada | CA | Canadian Dairy Commission (CDC) |
| Brazil | BR | Companhia Nacional de Abastecimento (CONAB) |
| Australia | AU | DairyAustralia |
| New Zealand | NZ | DairyNZ |
Upon data collection, EU countries were classified as fully harmonised, as they have already reached a consensus on reporting milk CoP among member states. To ensure consistent comparison, minimised harmonisation for EU countries and others was applied to adjust disparities across the reviewed nations.
Full harmonisation
EU member states have made progress in standardising methodologies for calculating milk CoP, aiming for full harmonisation through uniform data collection and cost calculation systems. This effort involves restructuring national systems to standardise sampling strategies and to harmonise calculation frameworks. In this study, three full harmonisation methods are compared: the IFCN, the EMB, and the EU Commission. While the EMB and the EU Commission rely on standardised data from the Farm Accountancy Data Network (FADN), the IFCN uses primary data from its own surveys. The tilde symbol (~) is used to indicate approximate data from the IFCN. Regional data, where available, help highlight geographical variations in milk CoP, hence facilitating comparisons with the IFCN’s Typical Farm Approach (TFA), the latter representing specific production systems, farm sizes, technologies, and milk volumes in each specific country/dairy region (CLAL.IT, 2024; Hemme et al., 2014). Regional milk CoP data for Canada is not available.
Minimalistic harmonisation
A minimalistic harmonisation approach for milk CoP uses existing databases without modifying national data collection systems. In this study, several adjustments are applied to make the data comparable across countries, including currency differences, milk cost units, inflation factors, and standardised milk quality (Table A.1). This approach is cost-effective and practical because it utilised existing data and minimises institutional changes (Langrell et al., 2012). Table A.1 presents the adjustments made to standardise milk CoP data, as the original datasets use various calculation units. First, weight units such as tons, hundredweight (cwt), hectolitres (hl), and litres were converted into kilograms (e.g., 1 cwt equals 45.359 kg). For data from Australia and New Zealand, 1 kg of milk solids was multiplied by the sum of fat and protein percentages divided by 100 to estimate the total milk weight. Second, the original currencies were converted into U.S. dollars (USD) to ensure comparability, utilising exchange rates from CLAL.IT (2024) and purchasing power parity (PPP) conversion factors from the World Bank (2025). PPP provides insights into the relative economic burden within countries by adjusting for cost of living and inflation, making it suitable for structural economic analysis. In contrast, the exchange rate method is more aligned with real-time financial conversions and international trade dynamics. However, using nominal exchange rates can be strongly misleading in cross-country price comparisons (Amat et al., 2014; Pant, Fisher, 2007). Thus, this study employed both methods to provide complementary perspectives. Third, milk units were standardised to energy-corrected milk (ECM) based on percentage of fat (% fat) and crude protein (% crude protein) using the formula (IFCN Dairy Network, 2018):
ECM (kg) = Milk (kg) × ((0.383 × Fat %) + (0.242 × Crude Protein %) + 0.7832)/3.1138
Finally, the producer price index (PPI) data from FAOSTAT (2025) were used to remove inflationary effects from nominal values, yielding real values of milk CoP in USD per 100 kg ECM, excluding the global milk farm gate price comparisons. In this study, the proportional and total milk CoP are presented as averages from 2018 to 2021, unless stated otherwise. Averaging the data minimises the effects of outliers and short-term fluctuations, providing a clearer understanding of regional cost structures by smoothing annual variations (Conigliani, Tancredi, 2009; Negrín, Vázquez-Polo, 2008).
2.2. Reporting practices and financial year considerations
Dairy operations may be based on different financial years for reporting, which can affect the comparability of financial data. Typically, the financial year for dairy operations aligns with the calendar year, such as January 1 to December 31 in the EU, the United States, and Brazil. Dairy operations follow a different financial year in Canada (August 1 to July 31) (Canadian Dairy Commision, 2024), Australia (July 1 to June 30) (Australian Bureau of Agricultural and Resource Economics and Sciences [ABARES], 2024), and New Zealand (April 1 to March 31) (DairyNZ, 2024). This variation in financial year reporting introduces a potential source of inconsistency in milk CoP data. For example, in cases where the financial year does not align with the calendar year, milk cost publication reports may state 2018/2019 because their calculations include portions of both 2018 and 2019. Therefore, this study assumes that the 2018/2019 milk CoP data from the reviewed countries reflects the year 2018, and similarly for other years. This assumption is based on the consistent seasonal patterns in milk production and minimal year-over-year variation observed in Canada, Australia, and New Zealand.
2.3. Methods for allocating joint farm costs
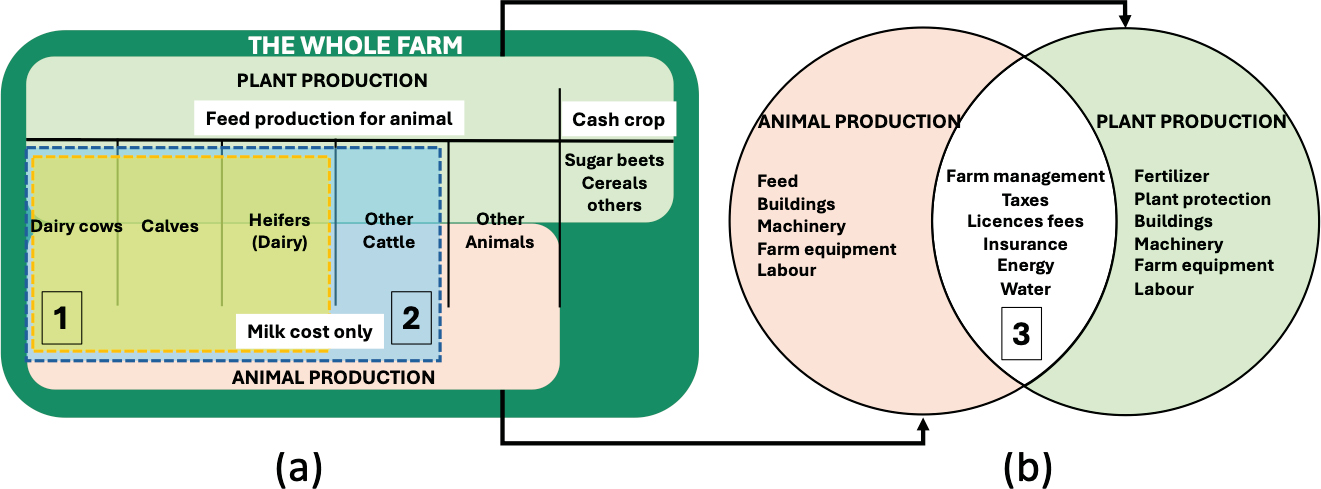
Joint cost allocation methods are commonly employed on mixed-use dairy farms to distribute costs among outputs such as milk and beef, which are derived from shared resources. Panel (a) on Figure 1a highlights yellow (1) and blue (2) areas representing different dairy animals included in the milk cost of production (CoP) calculation, which share feed production. Panel (b) shows the intersecting (3) and distinct resources utilised by animal and plant production, which share feed and cash crop costs. These methods vary by country and can impact the final milk CoP figures. For example, most countries consider only dairy cows (Figure 1a, number 1), while the EMB includes both dairy cows and other cattle (Figure 1a, number 2) when allocating feed costs, recognising that milk and beef are inseparable outputs. However, certain costs, such as farm management and energy (Figure 1b, number 3), remain difficult to allocate, regardless of the method used. Enterprise accounting methods can provide a more accurate allocation of these costs. On the other hand, the residual value method, which involves subtracting non-milk revenues (e.g., cattle sales) from total costs, or the proportional cost methods, which allocate costs based on revenue or specific cost items to calculate “milk cost only”, often lack clear justification and can introduce variability into the CoP calculations. Nevertheless, due to the minimalistic approach employed and the lack of detailed information provided by the data sources for each country, no harmonisation of joint farm cost allocation was applied.
2.4. Cost component categorisation
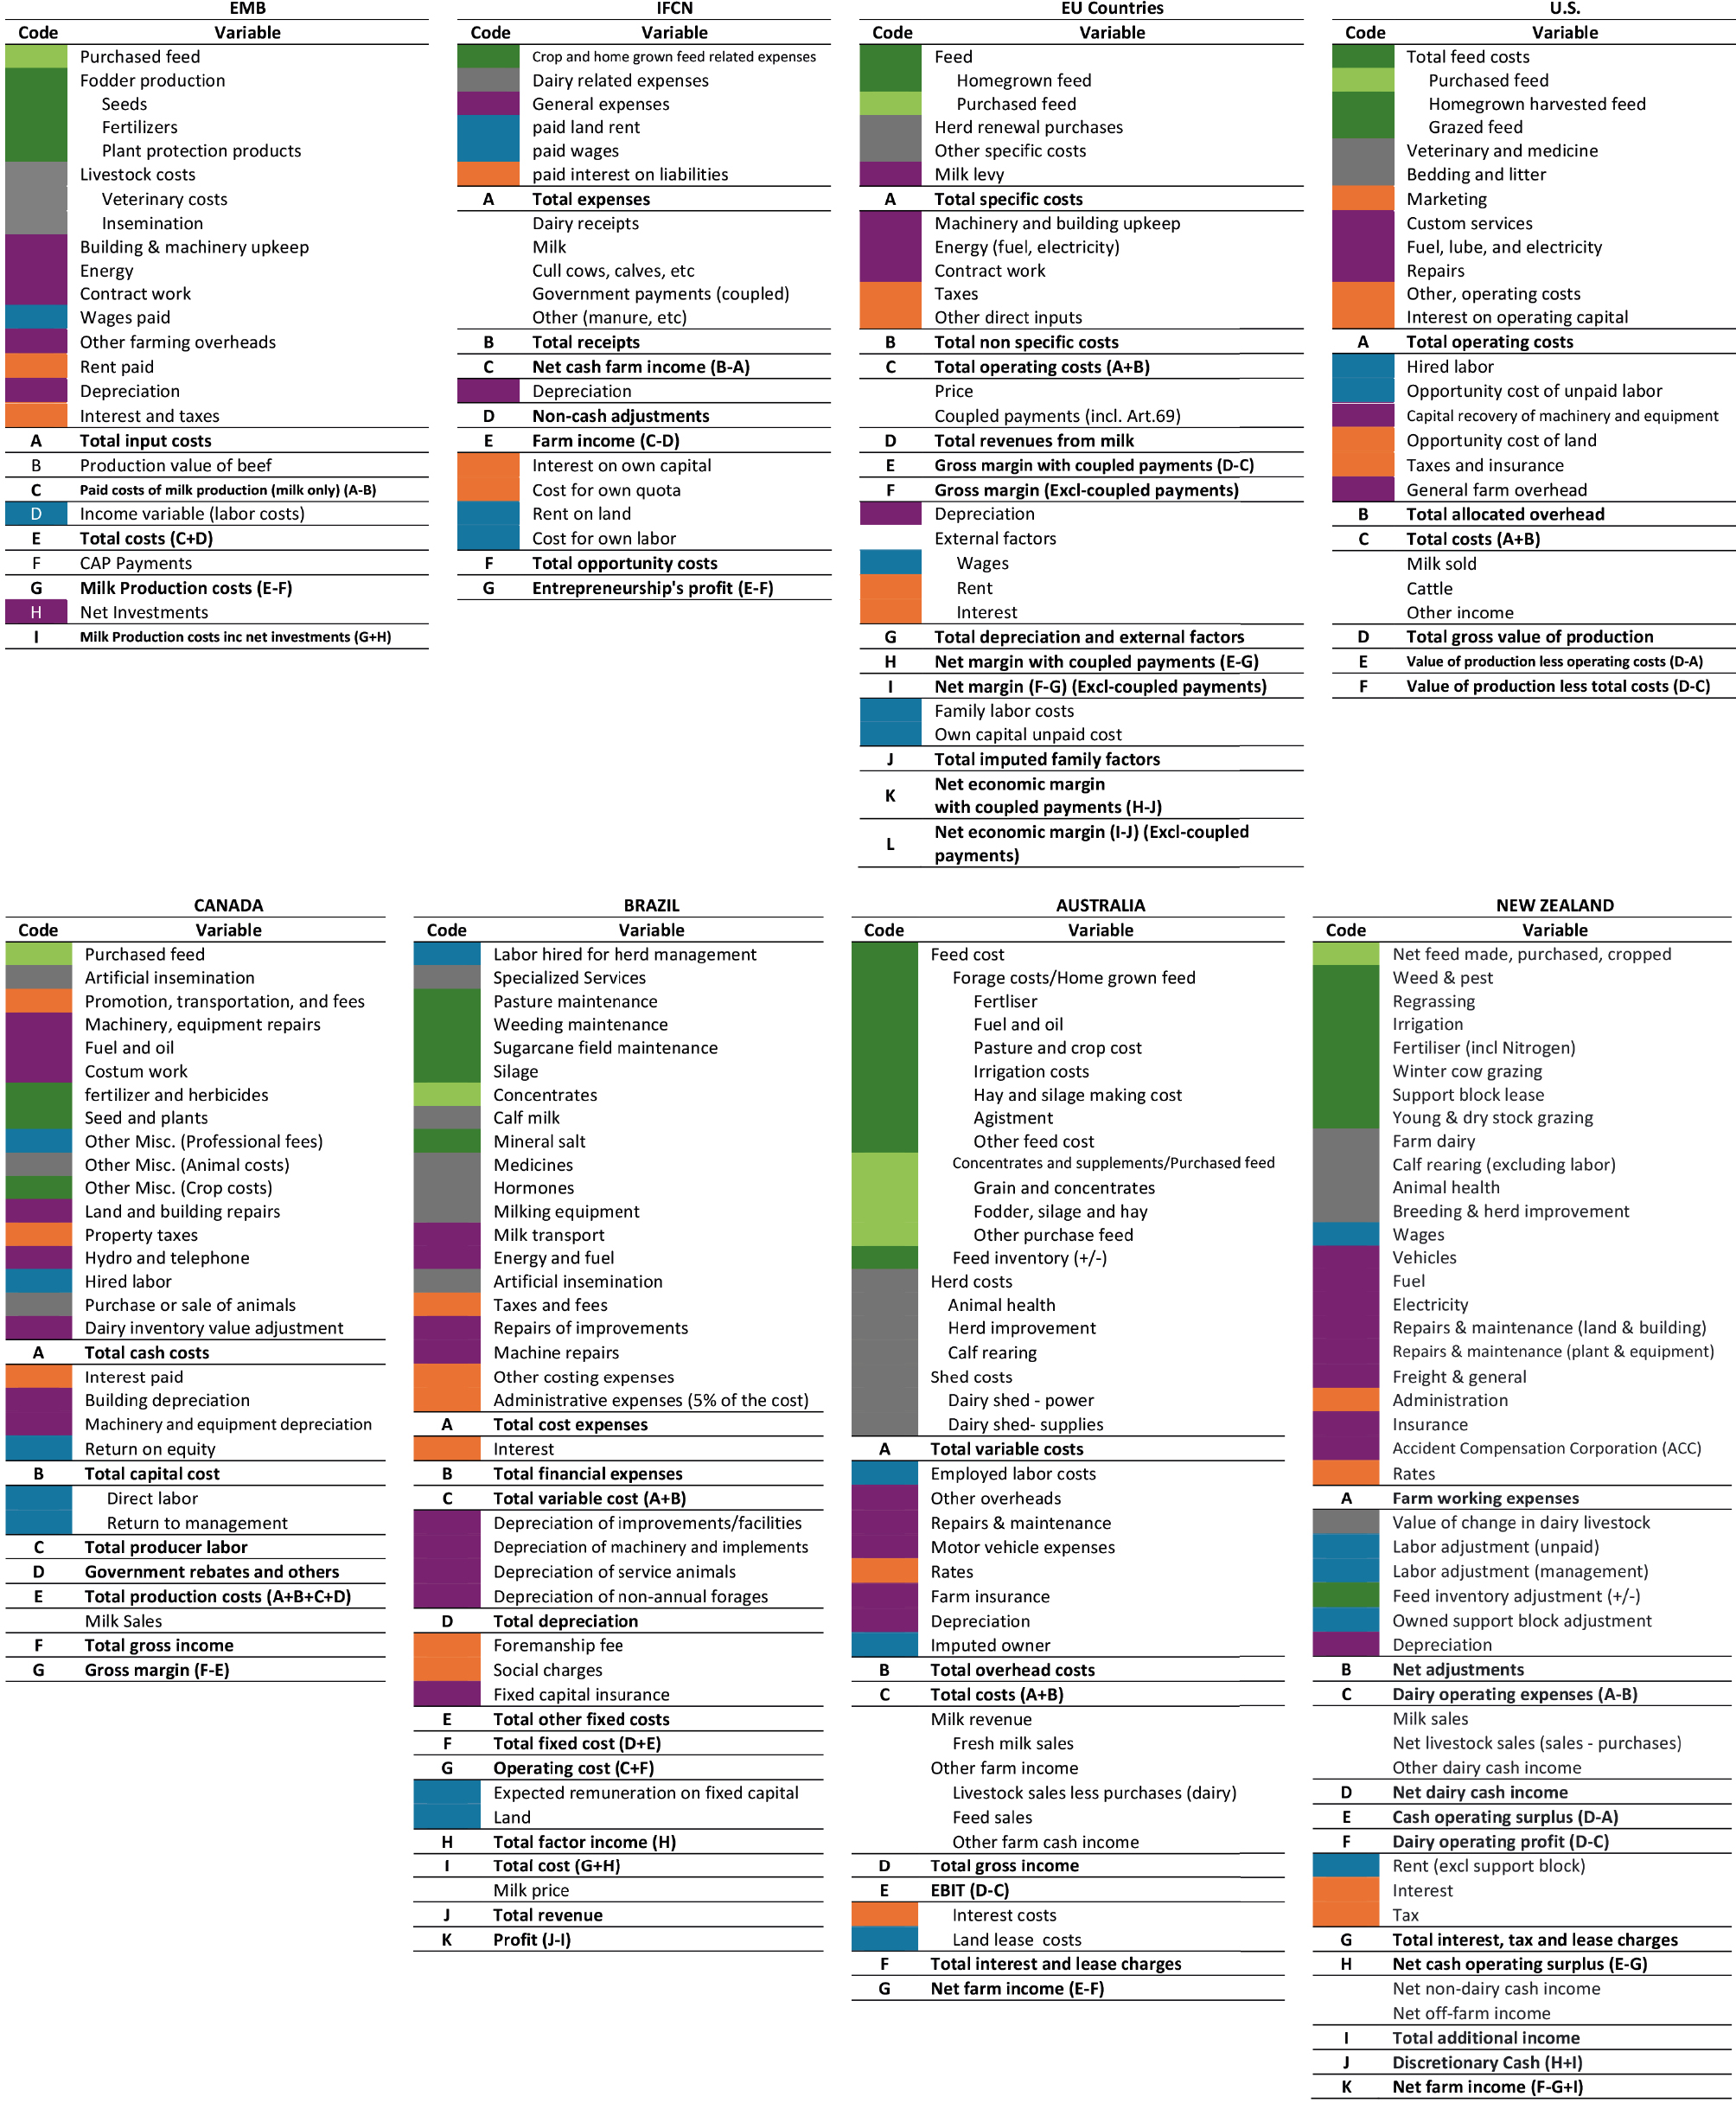
In this study, cost components refer to the various categories of expenses, such as feed cost, labour cost, or depreciation, that collectively contribute to the total cost of milk production. The color-coding scheme in Table A.2, guided by expert judgment and relevant references, distinguishes between homegrown feed (dark green), purchased feed (light green), hired labour and imputed owner (dark blue), dairy related expenses (grey), general expenses (purple), and other expenses (orange). This approach simplifies comparisons. Variations in costing methodologies (e.g., full costing vs activity-based costing), however, introduce some degree of complexity. Activity-based costing allocates costs to activities before tracing them to specific cost objects (Quesado, Silva, 2021), while some countries group costs differently depending on their national accounting systems. For example, some countries categorise fuel and oil as part of homegrown feed, while others classify them as separate expenses under the general expenses group (fuel and oil expenses).
3. Dairy farm characteristics
Accurate comparisons of milk CoP across countries require understanding key dairy farm characteristics like breed, milk yield, farming structures, and practices (Parzonko et al., 2024). Disparities in milk production efficiency, farm structure, and per-cow yield are evident, as shown in Table 2. The EU, contributing 19% of global milk production (CLAL.IT, 2024), has numerous small farms with extensive herds (Arendonk, Liinamo, 2003), while the United States achieves the highest per-cow milk yield, with Canada showing similar productivity despite fewer farms. The TFA farm size does not represent the average farm size in the respective country (Table 2). Instead, it reflects the sample farm size used by the IFCN in specific regions for cost estimation (see further up in the paper, Figures 3 and 4). This value is part of a model that standardises farming practices, ensuring that the actual average farm size is not misinterpreted as representing the entire country. Brazil, with no more than 8% of the global dairy cow population (CLAL.IT, 2024), has the lowest per-cow yield due to traditional practices and limited technology (Bernardes, Rêgo, 2014). New Zealand and Australia focus on large-scale operations, but they present moderate per-cow productivity due to extensive grazing systems (Luo, Ledgard, 2021).
| Country | Annual milk production1 (thousands of tons) | Number of dairy cows1 (thousands of heads) | Number of dairy farms1 | Typical Farm Approach farm size2 (heads) | Milk yield per cow per year1 (quintals) | ||||||||||||||
|---|---|---|---|---|---|---|---|---|---|---|---|---|---|---|---|---|---|---|---|
| EU27 | 160,785 | 20,523 | 826,170 | NA | 78.3 | ||||||||||||||
| Germany | 33,165 | 3,921 | 54,310 | 154 | 84.6 | ||||||||||||||
| France | 25,235 | 3,406 | 56,200 | 74 | 74.1 | ||||||||||||||
| Netherlands | 14,522 | 1,569 | 15,730 | 103 | 92.5 | ||||||||||||||
| Poland | 14,503 | 2,126 | 174,290 | 52 | 68.2 | ||||||||||||||
| Italy | 12,712 | 1,638 | 36,230 | 154 | 67.9 | ||||||||||||||
| Ireland | 8,542 | 1,456 | 17,500 | 91 | 58.7 | ||||||||||||||
| United States | 101,292 | 9,442 | 1,992,820 | 80 | 107.3 | ||||||||||||||
| Canada3 | 9,6203 | 1,4013 | 10,0953 | 66 | 66.73 | ||||||||||||||
| Brazil | 36,376 | 15,954 | 1,822 | 180 | 22.8 | ||||||||||||||
| Australia | 9,064 | 1,388 | 5,055 | 307 | 63.6 | ||||||||||||||
| New Zealand | 22,351 | 4,904 | 6,046 | 397 | 44.6 | ||||||||||||||
| Note: NA, not available. | |||||||||||||||||||
| Source: 1 CLAL.IT (2024); 2 IFCN Dairy Network (2022); 3 Canadian Dairy Commission (2024). | |||||||||||||||||||
Breed and management practices influence milk yield, with Holsteins predominant in Germany, France, Italy, and Ireland, achieving over 8,000 kg per lactation (Coffey et al., 2016; Probo et al., 2024). In Poland, Holstein imports have boosted the daily yield by 62% since 2004 (Ziętara et al., 2024). Crossbreeding in Ireland has improved milk solids, while grazing systems in the Netherlands have maximised productivity (Coffey et al., 2016; Weigel et al., 2001). Holsteins and Jerseys are common in the United States, Canada, Australia, and New Zealand, with Holsteins offering higher yields and Jerseys producing more butterfat (Hagan et al., 2021; Harris, 2005; Lozada-Soto et al., 2022; Nguyen et al., 2017; Oliveira et al., 2019). In Brazil, crossbreeding Zebu with Holstein enhances yields (Freitas et al., 1998). A once-a-day (OAD) milking frequency in pasture systems, such as those in Ireland (Murphy et al., 2023) and New Zealand (Jayawardana et al., 2023), can reduce labour but may not be universally feasible (Edwards, 2020; Lazzarini et al., 2018). Twice-a-day (TAD) milking remains more common, yielding higher milk production despite higher feed costs (Correa-Luna et al., 2021), although OAD raises concerns about animal health and welfare (Murphy et al., 2023).
4. Estimation of milk CoP and revenue
4.1. Milk CoP framework and typologies
Overview of milk CoP frameworks
The milk CoP framework for each country is detailed in Table A.2, with notations (e.g., A, B, C) to facilitate identification of calculations while preserving original cost item names. The EMB methodology adjusts for input costs using the “production value of beef” (Code B) and excludes non-dairy revenues but includes Common Agricultural Policy (CAP) payments to capture subsidy impacts. In contrast, the EU framework incorporates imputed family labour and opportunity costs (Code J). The IFCN methodology emphasises opportunity costs and “entrepreneurship’s profit” (Code G), incorporating unpaid labour, land rent, and capital use for global benchmarking and profitability analysis. The U.S. framework incorporates unpaid labour and land opportunity costs in its profit calculations, while Canada includes government rebates and Brazil details tropical-specific input costs. New Zealand focuses on “freight and general” costs, reflecting its export orientation. Canada and Brazil prioritise milk CoP and exclude revenue sources, assuming milk prices as the sole income.
Opportunity cost in milk production refers to the benefits a farmer forgoes by dedicating resources, such as land, labour, or capital, to milk production instead of other activities (Mykrantz, Bozic, 2022). The IFCN Dairy Network (2022) defines it as costs related to using owned resources, including land and family labour. U.S. methodologies integrate unpaid labour and land opportunity costs into their financial assessments, while Canadian and Brazilian frameworks adjust for policy and tropical-specific costs. Cost typologies vary by farm scale and financial needs, with small farms focusing on direct, cash, and variable costs, and large farms addressing fixed and capital costs (Inna et al., 2024). Financial management distinguishes between cash and non-cash costs, while economic approaches incorporate opportunity costs to reflect alternative values, in contrast to accounting approaches that focus on actual payments (FAO, 2016; Ronzon et al., 2014).
Key milk CoP components
The key cost components of milk production, including feed, labour, imputed owner costs, and depreciation, are critical to the overall cost structure and profitability of dairy farming (Chamberlain, 2012). These components are categorised differently across countries, as outlined in Table A.2. Feed costs are divided into the home-grown and purchased categories. Home-grown feed includes grazed feed and harvested feed like silage and haylage, which incur costs for pasture planting, maintenance, and storage. Purchased feed includes green fodder and dry fodder, which are bought externally, as well as concentrates, which may be produced on-farm or purchased (Reeson et al., 2008). In Australia and New Zealand, agistment or support block costs, referring to external grazing land rental or on-farm land maintenance, are also considered part of the feed costs (Table A.2).
Labour costs are classified into hired and unpaid labour, with most countries accounting for both, although Brazil and Australia may exclude unpaid labour (Table A.2). Hired labour is valued at market wage rates, while unpaid labour, typically family labour, is valued differently depending on working hours, willingness to pay, or regional wages (FAO, 2016). Capital investment is valued variably across frameworks, with the IFCN and the United States using opportunity costs, the EU using imputed family factors, reflecting market wages or the payment based on willingness to pay (Agricultural & Applied Economics Association [AAEA], 2000). Brazil calls it factor income, and Australia labels it imputed owner costs (Table A.2). Depreciation, which accounts for the reduction in the useful life of assets such as machinery and breeding animals, also plays a significant role in cost structures. It is typically calculated using the straight-line method to align costs with long-term milk production (Berg, Moore, 1989; Williamson, Stutzman, 2016).
4.2. Proportional analysis of milk CoP components
Table 3 shows the average cost structure per kilogram of milk ECM from 2018 to 2021, offering a stable comparison of cost components across regions. Each country follows its own calculation method, as detailed in Table A.2. New Zealand and Australia, with their pasture-based systems, allocate a larger share of costs to home-grown feed, reducing overall production costs but also exposing them to risks from weather conditions or seasonal variations (Kamal, Noy, 2023). In contrast, Italy and Australia report the highest proportions of purchased feed and concentrate costs, making them more vulnerable to global commodity price fluctuations. These variations in feed costs illustrate the value of international comparisons and underscore the impact of production systems and market dependencies on cost structures (Ozawa et al., 2005).
| Country | Home grown feed | Purchased/concentrate feed | Hired labour cost | Imputed owner | Dairy-related expenses | General expenses | Other expenses | Total |
|---|---|---|---|---|---|---|---|---|
| EU27 | 9.7 | 22 | 5.3 | 17.4 | 0.6 | 33.1 | 12 | 100 |
| Germany | 7.6 | 19.6 | 6.8 | 15.8 | 0.8 | 36.8 | 12.7 | 100 |
| France | 8.1 | 19.1 | 2.5 | 13.5 | 0.4 | 39.3 | 17.2 | 100 |
| Netherlands | 6.9 | 22.7 | 1.7 | 17.4 | 0.5 | 34 | 16.9 | 100 |
| Poland | 14.2 | 17.3 | 3.8 | 28.6 | 0.9 | 30.2 | 5.1 | 100 |
| Italy | 13.7 | 32.2 | 5.7 | 19.6 | 0.7 | 19.9 | 8.2 | 100 |
| Ireland | 9.8 | 20.8 | 3.6 | 23.7 | 0.8 | 32.9 | 8.5 | 100 |
| United States | 15.3 | 32.2 | 9.2 | 7.9 | 4.2 | 29.4 | 2 | 100 |
| Canada | 4.2 | 23.4 | 4.9 | 29 | 2.3 | 23.4 | 12.8 | 100 |
| Brazil | 10.2 | 20.5 | 17.8 | 16.6 | 5 | 19.2 | 10.8 | 100 |
| Australia | 15.8 | 32.9 | 11.7 | 13.3 | 7.7 | 14.1 | 4.5 | 100 |
| New Zealand | 15.8 | 15.3 | 9.2 | 9.7 | 8.3 | 18.3 | 23.4 | 100 |
Labour cost distributions vary across regions, reflecting differences in farming practices. Brazil has the highest proportion of labour costs, while the Netherlands and France report much lower labour costs due to efficient feed use and high milk production per cow (Thomassen et al., 2009). These differences highlight how labour efficiency influences milk CoP and profitability. Imputed owner costs also reveal structural differences in farming operations, with Poland and Canada showing higher proportions due to family-owned farms, while the United States reports lower imputed owner costs (Tian et al., 2020). General expenses, which reflect technological adoption and infrastructure, are highest in Germany and France, indicating substantial investments in farm efficiency (Ruzzante et al., 2021). These differences in cost structures impact regional competitiveness, resilience to economic shocks, and global market positioning (Beber et al., 2021).
4.3. Global variations in total milk CoP
The EU shows significant internal variation in average milk CoP from 2018 to 2021, with notable contrasts between Western and Eastern Europe (Table 4). Poland reports lower costs compared to the Netherlands, Italy, Germany, and France, due to differences in farm practices, labour costs, and technological adoption (Table 3). American producers generally face higher costs, with Canada notably impacted by high feed, labour, land, and machinery costs (Hemme et al., 2014). In contrast, Brazil’s milk CoP is lower, reflecting intensive production methods and advanced technology use, while the United States remains more competitive. Oceania presents diverse profiles, with Australia maintaining relatively lower costs due to deregulation and economies of scale dynamics (Dobson, Wagner, 2000; Phillipov, Loyer, 2019), while New Zealand experiences higher costs due to rising input prices and tax policies (Frengley, Johnston, 1992; Kamal, Noy, 2023).
| Country | Home grown feed | Purchased/concentrate feed | Hired labour cost | Imputed owner | Dairy related expenses | General expenses | Other expenses | CoP1 | CoP2 | ||||||||||
|---|---|---|---|---|---|---|---|---|---|---|---|---|---|---|---|---|---|---|---|
| EU27 | 5 | 11.4 | 3 | 8.9 | 0.4 | 18.1 | 6.5 | 53.3 | N.A. | ||||||||||
| Germany | 4 | 10.2 | 3.6 | 8.3 | 0.4 | 19.3 | 6.7 | 52.5 | 31.8 | ||||||||||
| France | 4.1 | 9.5 | 1.2 | 6.8 | 0.2 | 19.7 | 8.6 | 50.1 | 31.5 | ||||||||||
| Netherlands | 4.0 | 13.0 | 1.0 | 9.9 | 0.3 | 19.4 | 9.6 | 57.2 | 37.1 | ||||||||||
| Poland | 6 | 7.3 | 1.6 | 9.3 | 0.4 | 12.8 | 2.2 | 39.6 | 58.3 | ||||||||||
| Italy | 6.3 | 14.9 | 2.6 | 9.1 | 0.3 | 9.2 | 3.8 | 46.2 | 25.0 | ||||||||||
| Ireland | 4.6 | 9.7 | 1.7 | 11.1 | 0.4 | 15.4 | 4.0 | 46.9 | 32.4 | ||||||||||
| United States | 7.6 | 16.0 | 4.6 | 3.9 | 2.1 | 14.6 | 1.0 | 49.8 | 49.8 | ||||||||||
| Canada | 2.8 | 15.3 | 3.2 | 18.9 | 1.5 | 15.3 | 8.4 | 65.4 | 102.4 | ||||||||||
| Brazil | 5.3 | 10.3 | 9.1 | 9.2 | 2.6 | 10 | 5.7 | 52.2 | 508.0 | ||||||||||
| Australia | 6.9 | 14.4 | 5.1 | 5.8 | 3.3 | 6.2 | 2.0 | 43.7 | 88.4 | ||||||||||
| New Zealand | 8.3 | 8.0 | 4.8 | 5.1 | 4.4 | 10.1 | 11.7 | 52.4 | 112.1 | ||||||||||
| Note: CoP1 refers to the total milk cost of production calculated using exchange rate calculation. CoP2 refers to the total cost based on the purchasing power parity (PPP) approach calculation. | |||||||||||||||||||
| Source: Data and calculations are based on the European Commission (2021) for the EU27, USDA (2024) for the United States, the Canadian Dairy Commission (2024) for Canada, CONAB (2020) for Brazil, DairyAustralia (2024) for Australia, and DairyNZ (2024) for New Zealand. | |||||||||||||||||||
Moreover, milk CoP calculated using the PPP approach is significantly lower than when using exchange rates, with differences ranging from 10 to 20 USD/100 kg ECM in EU countries. This discrepancy arises because nominal exchange rates fluctuate around their PPP values rather than precisely reflecting them (Sercu et al., 1995). Consequently, calculations based on exchange rates may overvalue production costs, especially in countries with a higher proportion of non-tradable inputs and elevated general price levels, as these rates do not accurately capture local purchasing power. By comparing PPP-adjusted costs, we can evaluate the relative efficiency of milk production across countries (Biesebroeck, 2009; Bureau, Butault, 1992). Lower PPP-adjusted costs may suggest more efficient production processes or favourable economic conditions (McNown, Wallace, 1989), as observed in most EU countries in this study, excluding Poland (Table 4). However, it is understandable that Brazil exhibits extremely high milk PPP-adjusted costs due to its economy with high inflation (McNown, Wallace, 1989).
4.4. Farm gate milk price comparisons
In this section, we analyse prices from the milk trader’s perspective, where nominal values reflect current market prices and provide a direct snapshot of price competitiveness and market dynamics, which are key for assessing trade positions and pricing strategies in global markets. Farm gate milk prices experienced fluctuations but stabilised after the EU abolished its milk quota in 2015, averaging 42.87 USD/100 kg ECM from 2016 to 2024 (Figure 2). Prices within the EU varied significantly, with Poland recording the lowest average price, reflecting its production efficiency (40.55 USD/100 kg ECM) (Ziętara et al., 2024), while Italy reported higher average prices (45.28 USD/100 kg ECM), influenced by consumer preferences for local and differentiated products (Bimbo et al., 2016). From February 2020, farm gate milk prices began to rise due to supply concerns linked to coronavirus 2019 (COVID-19) restrictions, with a sharp peak following the Russia-Ukraine conflict in February 2022. Disruptions in Ukraine, a key supplier of agricultural inputs, further increased costs (Brunk, Hakimi, 2022). By 2023, milk prices declined due to adjustments in global supply and demand.
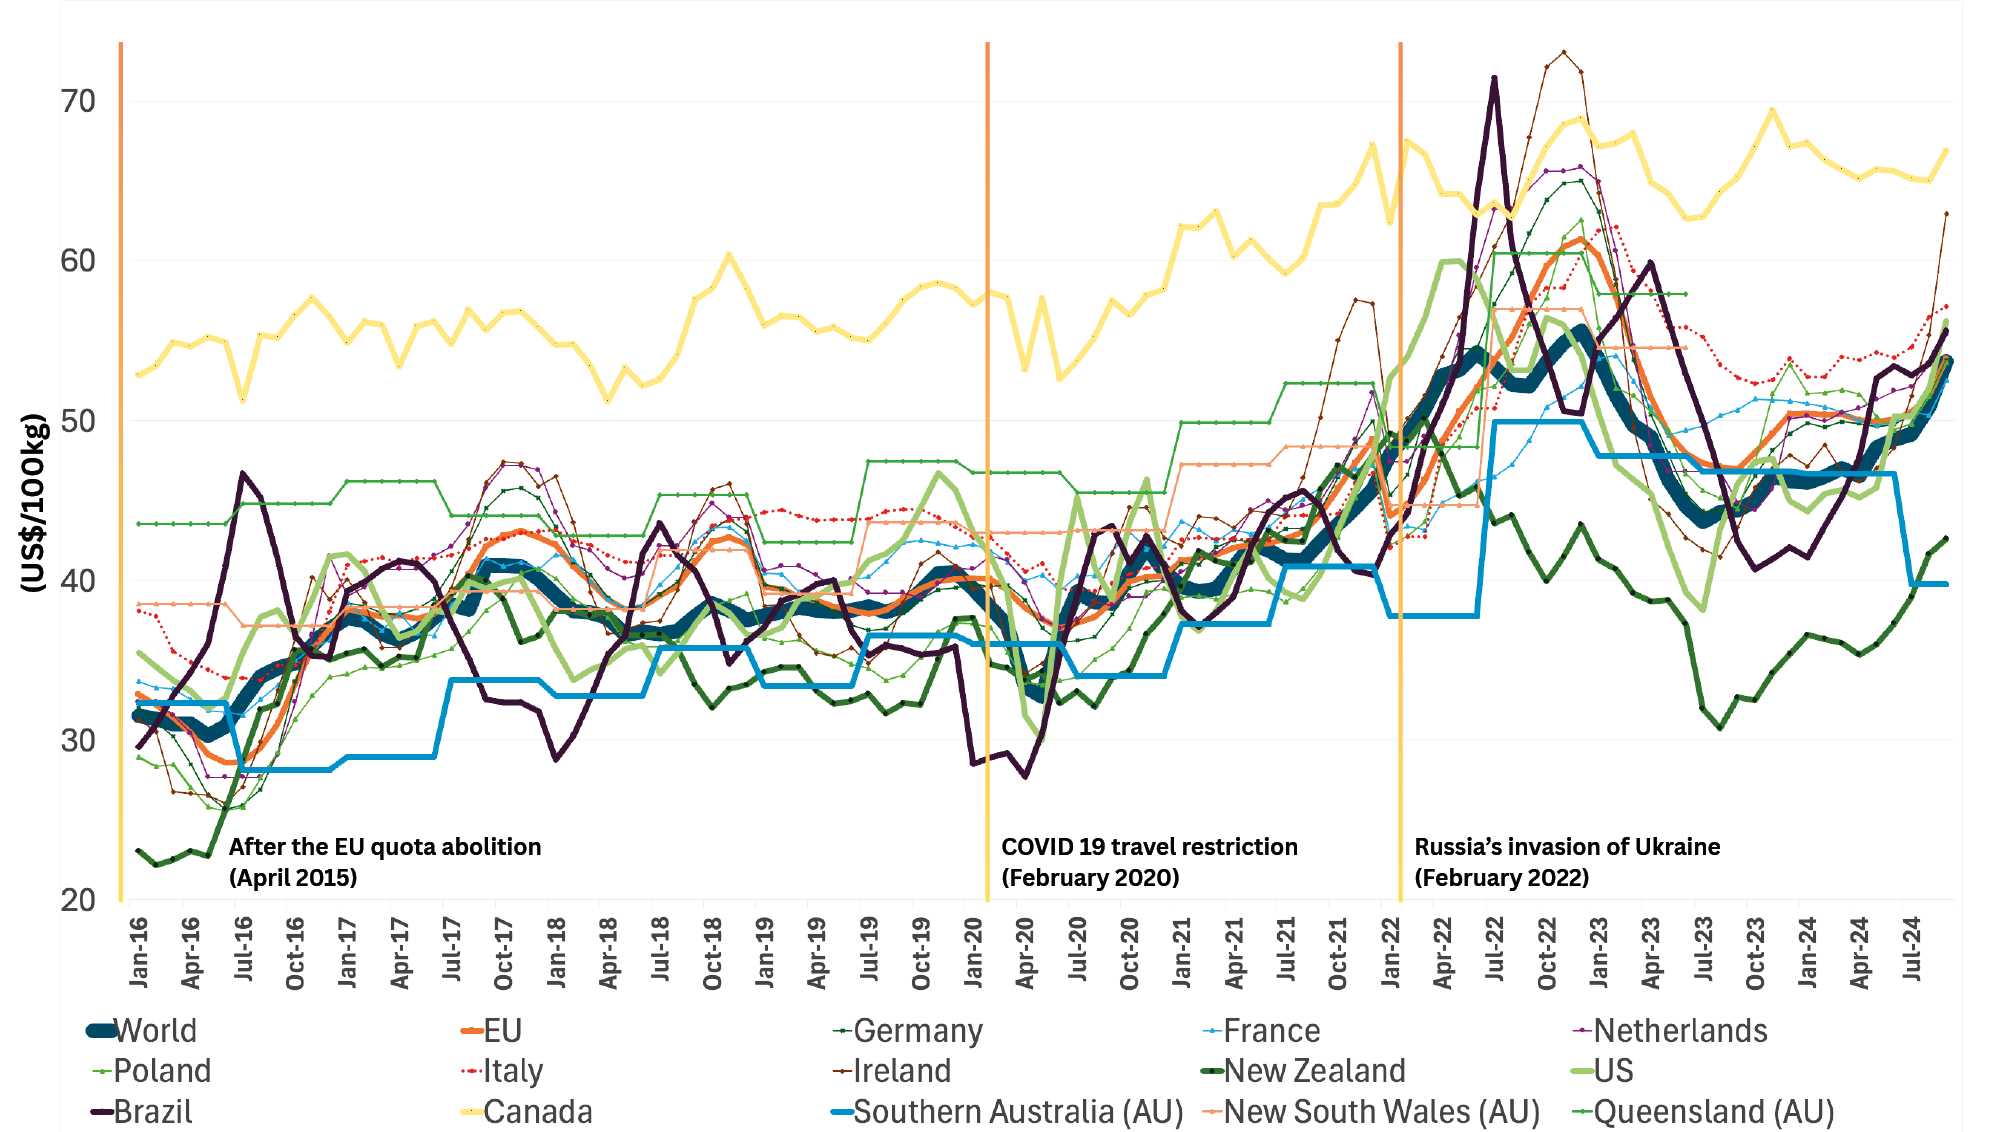
Globally, the average milk price was 41.55 USD/100 kg ECM, with notable regional variations (Figure 2). New Zealand’s price of 36.82 USD/100 kg ECM reflects its export-oriented, grass-based system but also highlights its vulnerability to market and climatic fluctuations (FAO, 2023; Kamal, Noy, 2023). The United States averaged 42.24 USD/100 kg ECM, while Canada recorded the highest price at 59.59 USD/100 kg ECM, due to its supply management system, which balances stable farmer income with reduced international competitiveness. Brazil’s price of 41.87 USD/100 kg ECM is competitive, driven by cost advantages in inputs, although it still faces infrastructure challenges. In Australia, milk prices remained relatively stable due to alignment with the dairy financial year, with regional variations including 37.64 USD/100 kg ECM in Southern Australia, 43.62 USD/100 kg ECM in New South Wales, and 47.84 USD/100 kg ECM in Queensland (Figure 2). These regional differences are influenced by climatic conditions and operational practices (ABARES, 2024), reflecting how local factors impact overall farm gate milk prices.
4.5. Quantitative insights into cost and revenue margin estimates
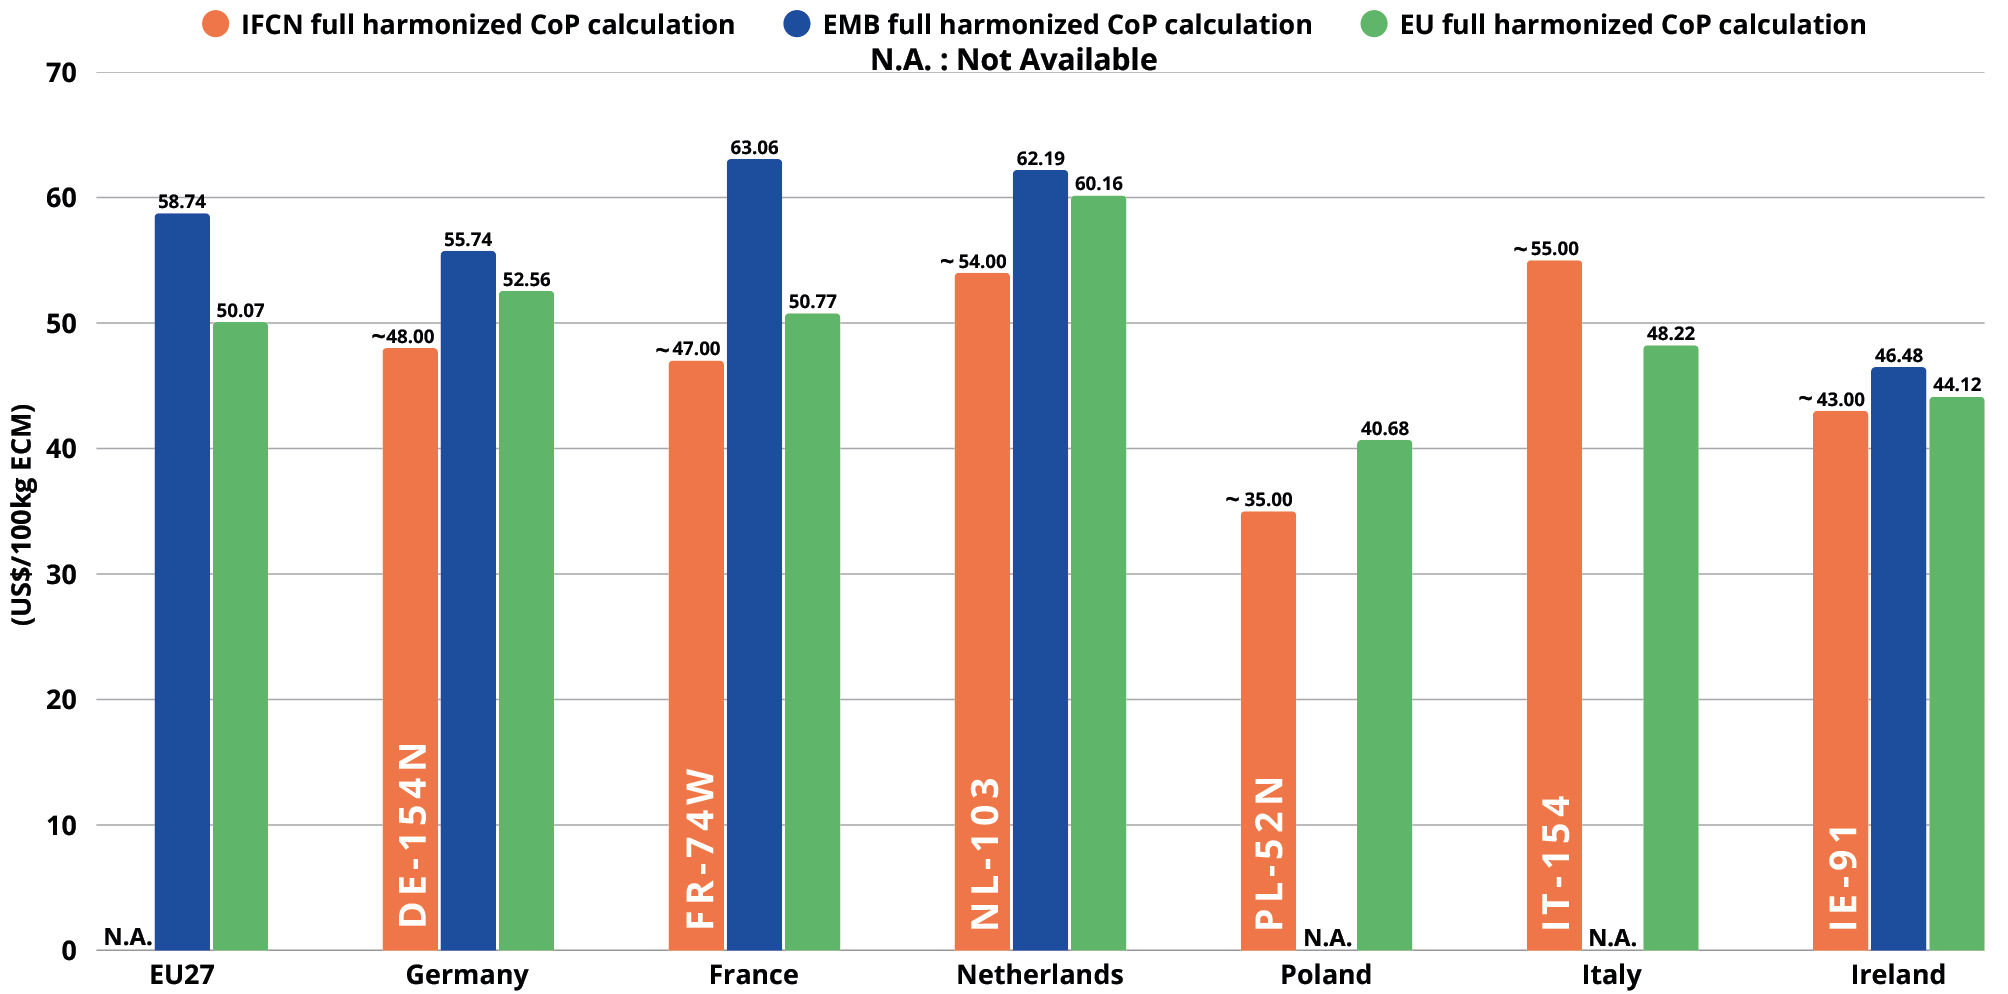
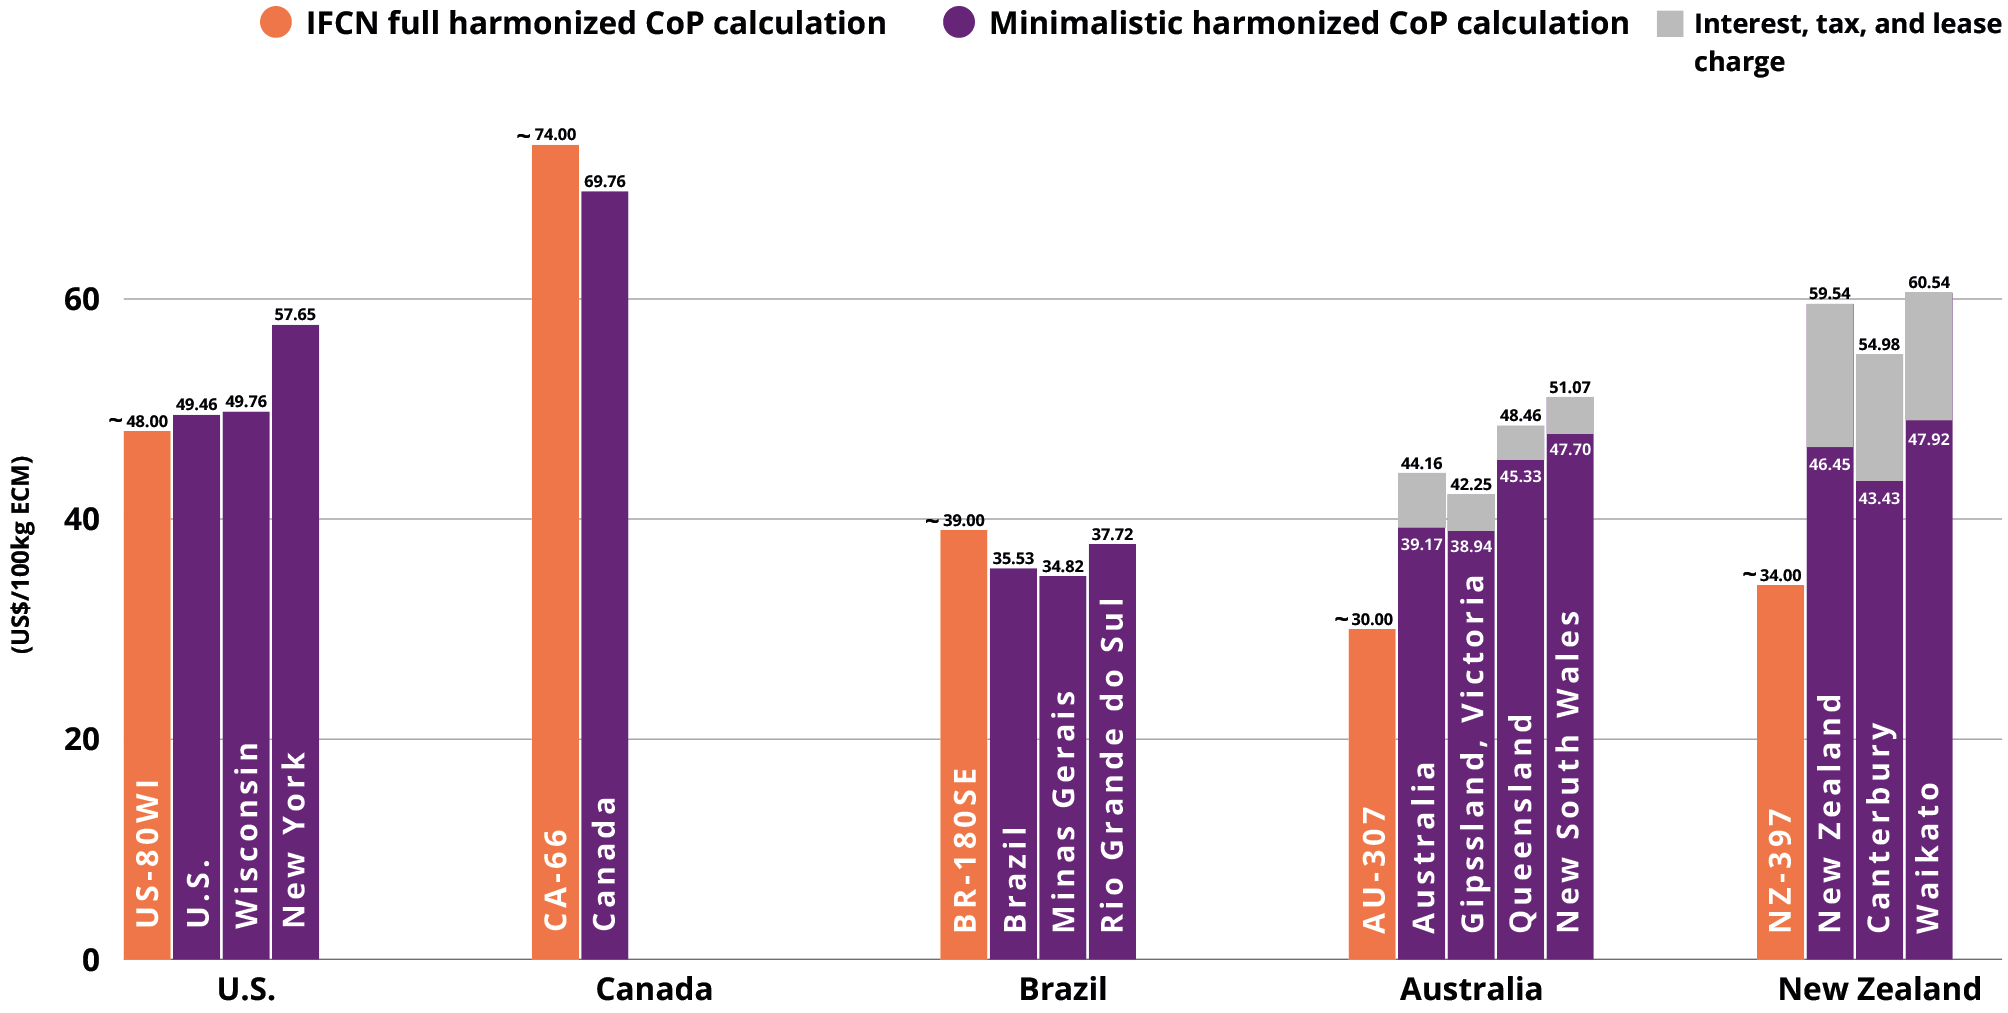
The comparison of 2021 data using the IFCN, EMB, and EU Commission milk CoP methodologies reveals both consistent patterns and significant disparities (Figure 3). The EMB consistently reports higher milk CoP, with France at 63.06 USD/100 kg ECM, compared to 50.77 USD/100 kg ECM reported by the EU Commission and 47 USD/100 kg ECM reported by the IFCN. These differences reflect the varying methodologies, such as the EMB’s inclusion of additional cost factors (e.g., other livestock roughage eaters). The IFCN methodology consistently yields the lowest CoP, except in Italy, while higher CoP results are seen in the Americas, particularly in Canada and Brazil (Figure 4). These discrepancies underline the impact of the methodology on CoP estimates, which can affect farmers’ understanding of their cost structures. Such international comparisons are crucial for assessing regional competitiveness and understanding local influences on CoP.
In Australia and New Zealand, excluding financial components like interest and taxes creates discrepancies compared to the IFCN estimates. For example, in Canterbury, excluding these charges reduces CoP from 54.98 USD/100 kg ECM to 43.43 USD/100 kg ECM (DairyNZ calculation), whereas the IFCN estimate is lower at 34 USD/100 kg ECM. New Zealand’s milk production costs, driven by feed, wages, and interest charges, reflect additional financial burdens placed on farmers (Kamal, Noy, 2023; Ozawa et al., 2005). These regional variations in cost structures provide valuable insight into the factors influencing CoP across diverse dairy systems.
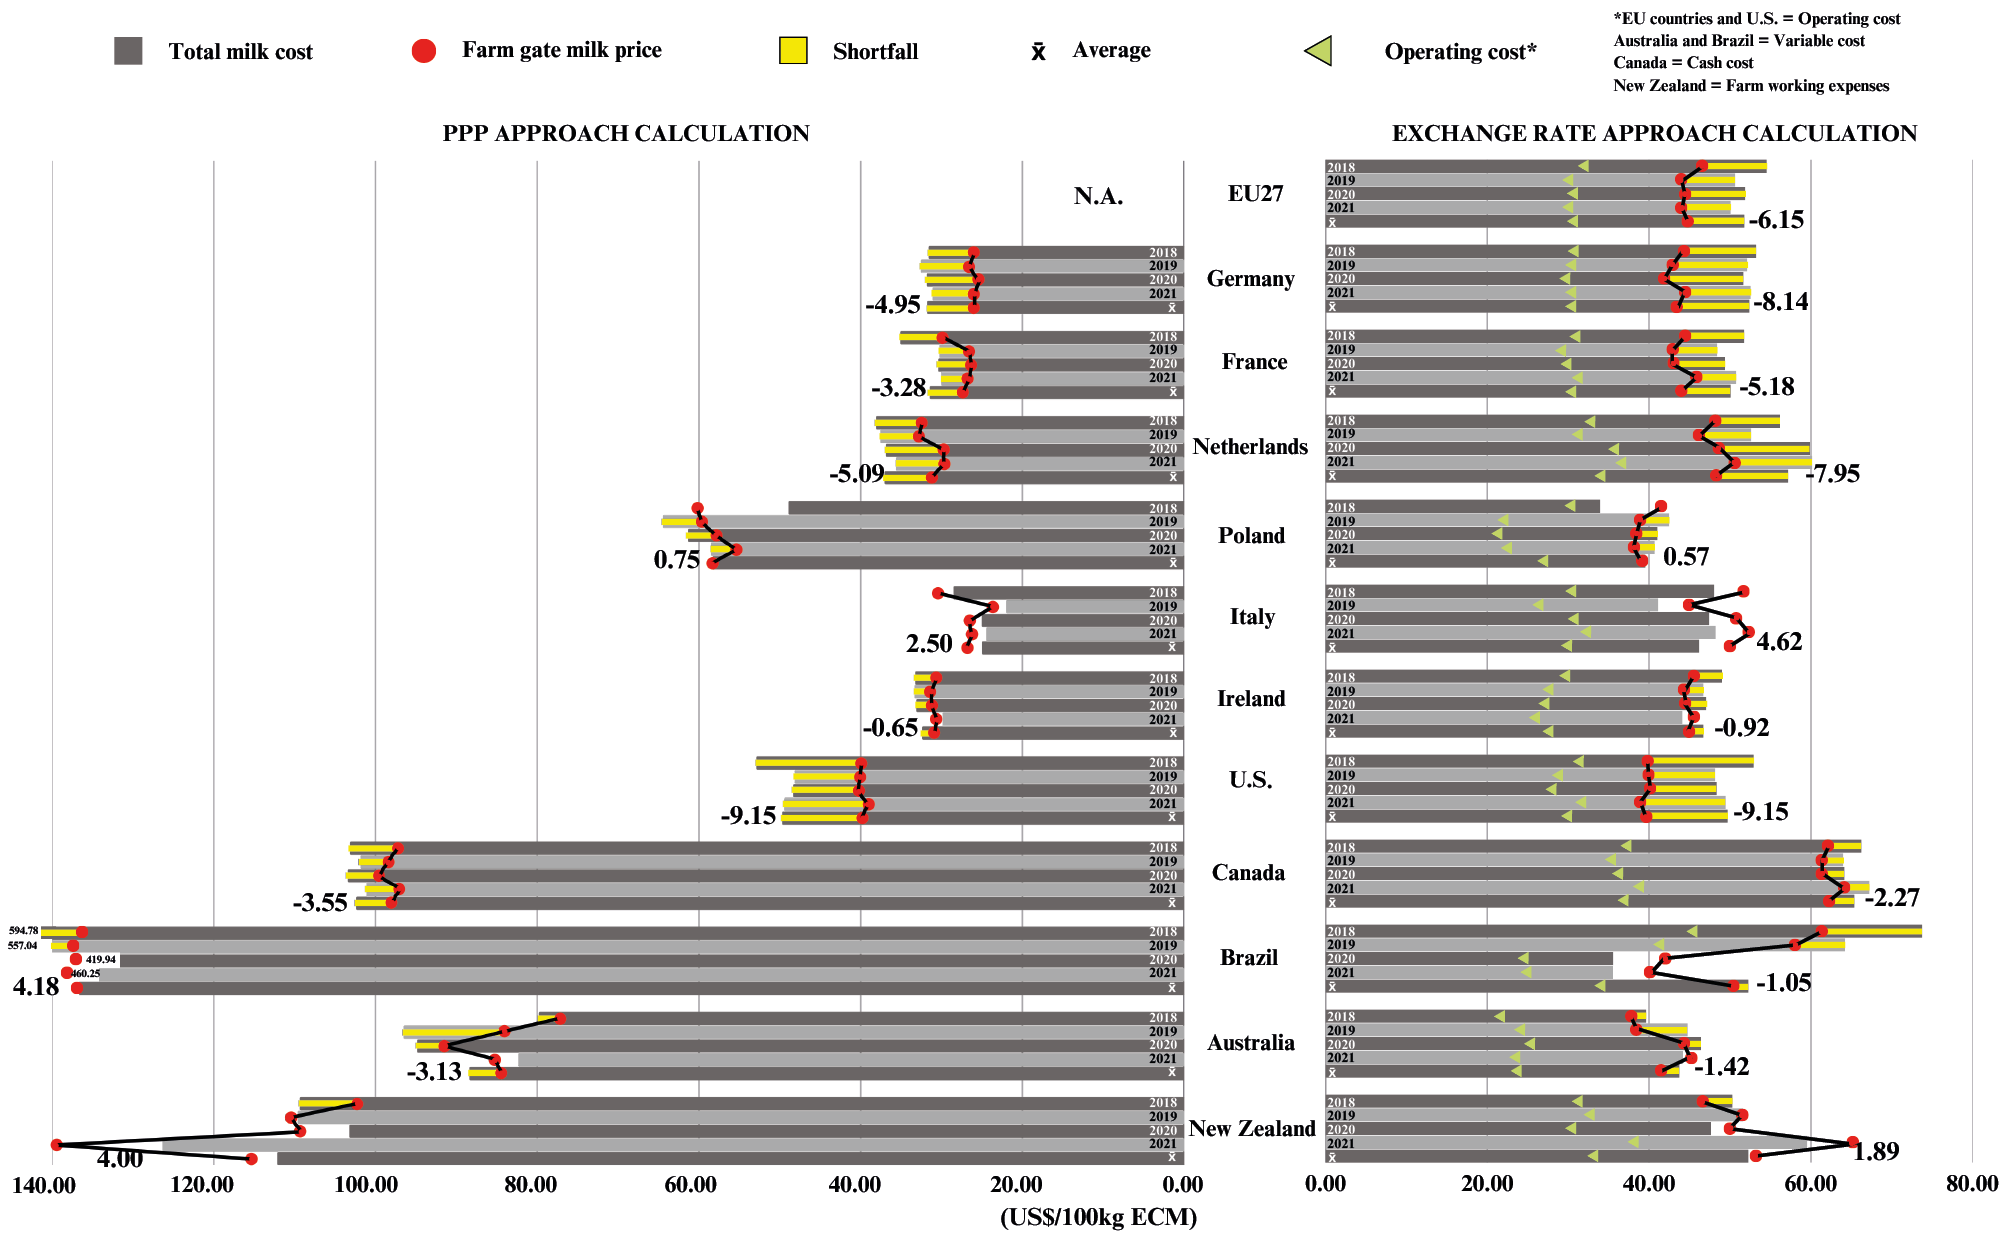
The disparity between milk CoP and farm gate prices reveals significant financial challenges in the dairy sector (Figure 5). Most regions experience persistent shortfalls in covering production costs, although New Zealand and Italy manage to align prices with or exceed CoP, offering better profitability. New Zealand’s grass-based system helps keep costs low, while Italy’s premium dairy products, such as specialty cheeses, drive higher prices (Chatellier, 2021). In contrast, the United States faces the largest shortfall of 9.15 USD/100 kg ECM from 2018 to 2021, indicating significant cost pressures. When using PPP-adjusted costs, the discrepancies in milk cost and price are smaller, with Brazil showing a positive margin, suggesting that in real terms, Brazilian producers may achieve profitability. This comparison demonstrates how different CoP methods, including or excluding cost items, may distort the disparities in the economic performance of dairy operations. Further, this study highlights the potential bias interpretation in the dataset used for CoP estimates, which should be considered a limitation (Figure 5). Indeed, the choice between typical farms and farm samples can impact both costs and revenues, while structural efficiency and milk prices vary significantly across farms. This variability may explain the apparent profitability of milk production in countries like Italy, despite a decline in production and farm closures in recent years (European Commision, 2021).
5. Discussion and concluding remarks
The diversity in cost categorisations complicates global comparative analysis and policy development, as inconsistencies across countries arise from differences in the components of each cost category. For example, Canada’s “total cash costs” focus solely on direct monetary outflows, excluding non-monetary costs (Canadian Dairy Commision, 2024), while Brazil’s “total variable cost” includes financial aspects (CONAB, 2020). New Zealand’s “farm working expenses” cover a wide range of variable costs (DairyNZ, 2024), while Australia’s “variable costs” are tied to milk production levels (DairyAustralia, 2024) and the “operating costs” in the United States define all the costs of expendables be allocated to the generic group (AAEA, 2000). The EU’s “operating cost” includes both specific and non-specific expenses, aiding in the calculation of gross margins for different production types (European Commision, 2021). These differences highlight that direct comparisons of milk CoP across countries are not feasible without fully harmonised CoP methods to standardise cost typologies.
The categorisation of key cost components, such as feed, hired labour, capital, and depreciation, varies significantly across countries (Table A.2), reflecting differences in economic and agricultural contexts. Feed costs, which account for at least 28% of total milk CoP (Atzori et al., 2021), are a key indicator of dairy farm performance. Hired labour costs are important for assessing farm competitiveness (Antonioli et al., 2023), while capital and depreciation provide insights into technology adoption (Upton et al., 2015). Based on these discrepancies, caution is needed when comparing milk CoP across countries, as differing frameworks result in divergent cost assessments.
This review reveals contrasting approaches to valuing land resources and unpaid labour. The IFCN, U.S., and EU frameworks incorporate opportunity costs, while others prioritise real expenditures based on actual transactions. The U.S. approach links opportunity cost pricing to more stable milk prices and reduced regulatory costs (Mykrantz, Bozic, 2022), whereas in the EU, opportunity costs lead to significant regional differences in farming income (Špička, Dereník, 2021). These costs may also misrepresent the viability of small-scale farms reliant on family labour and owned resources (Viira et al., 2009), while overlooking non-financial motivations and policy concerns (Ocean, Howley, 2023). Incorporating opportunity costs provides a more accurate representation of farm economics, addressing regional factors that influence decision-making (AAEA, 2000; European Commision, 2021; IFCN Dairy Network, 2022). This approach is critical for understanding the true cost of decisions, including the opportunity cost of resources used in milk production.
The inclusion of cattle sales and subsidies in milk CoP calculations introduces further complexity. For example, the EU includes herd renewal costs and subsidies but excludes cattle sales from milk revenue, while the United States includes cattle sales and omits subsidies (Table A.2). These structural differences affect CoP outcomes, as the EMB consistently reports higher CoP across EU countries due to the inclusion of additional livestock roughage eaters (Figure 3). Moreover, regional differences in the economic significance of cattle sales and subsidies are highlighted by regions reliant on dual-purpose breeds, where cattle sales offer a more comprehensive representation of farm economics (Zanon et al., 2020, 2023). This is particularly relevant in regions with high beef prices, where dual-purpose systems integrate milk and meat production more cost-effectively (Krupová et al., 2016).
Our study illustrates how milk CoP methods differ among milk-producing countries and how these differences may impact business decisions and dairy trade policies. The price competitiveness of dairy trade is heavily impacted by cost assumptions. In Canada, assuming a low local cost structure turns Canada into a major exporter under free trade, while high-cost assumptions suggest losses and contraction (McLachlan, Van Kooten, 2022). Countries that exclude capital, opportunity, or compliance costs may appear artificially competitive, affecting their resistance to tariff cuts and driving demands for special protection in trade negotiations (Langley et al., 2006; McLachlan, Van Kooten, 2022). For example, the EU imposes a 40% tariff on Canadian dairy products, while Canada applies a 230.38% import tariff on EU products (Sanjuán et al., 2023). Furthermore, subsidies also play a crucial role in boosting trade by making dairy exports seem more efficient. However, when subsidies are viewed as cost reductions rather than revenue support, they may mask dependence on public funds, distorting the World Trade Organization’s Aggregate Measure of Support calculations and influencing subsidy reform debates (Kondaridze, Luckstead, 2023; Langley et al., 2006; Milić et al., 2023).
Non-tariff measures (NTMs), such as sanitary and phytosanitary (SPS) measures, represent significant costs, with an average 10% ad valorem equivalent (AVE; the percentage increase in import costs due to trade barriers) in EU dairy trade (Sanjuán et al., 2023). These measures, designed to protect health and safety, can distort trade when exporters include or exclude SPS compliance costs in their price calculations, so AVE estimates and perceptions of “too strict” NTMs are not comparable (Kondaridze et al., 2025; Sanjuán et al., 2023). Though harmonising with EU rules may reduce SPS costs, it benefits only highly competitive exporting countries (Sanjuán et al., 2023). Furthermore, efficiency and investment decisions in the dairy sector are influenced by trade liberalisation, which shifts production towards low-cost, pasture-based systems, such as those in New Zealand and Ireland (Dillon et al., 2008; Langley et al., 2006). If countries miscalculate inefficiencies (i.e., by assuming the inclusion of full cost items), they may over-invest in protection or fail to design effective stabilising measures (Biden et al., 2020). For example, Serbia’s low milk prices, aimed at consumer protection, were regulated by importing dairy products from the EU under free trade agreements, leading to protests from farmers (Milić et al., 2023).
Given the methodological disparities, global comparisons of milk CoP require careful consideration of local contexts and farm systems. The IFCN’s TFA aligns well with national calculations in many regions, but its limitations are evident in areas with distinct farm systems, such as Australia and New Zealand (Figure 4). Indeed, further refinement of the TFA is necessary to better capture regional variations and to make rankings of low- versus high-cost regions more meaningful for trade and investment decisions. While standardisation is important for policy and benchmarking, harmonising an entire country’s CoP methods is expensive. Therefore, we argue that existing CoP methods from global dairy networks, such as the IFCN, which have developed harmonised methodologies alongside national approaches and local contexts, could serve as a valuable alternative to the PPIs provides by the FAO. This approach may enhance future studies on international competitiveness and help prevent distortions in international dairy trade by utilising consistent data, rather than relying on country-specific accounting practices.
Acknowledgements and Funding
The authors gratefully acknowledge the contribution of the entire staff of the working group Animal Science at Free University of Bozen-Bolzano. The open access publication of this article was supported by the Open Access Publishing Fund provided by the Free University of Bozen-Bolzano (Bolzano, Italy).
Author contributions
AT: methodology, investigation, data curation, formal analysis, writing (original draft), and visualization; TZ: conceptualization, supervision, formal analysis, data curation, methodology, investigation, writing (review and editing), funding acquisition, and visualization; MC: data curation, methodology, and writing (review and editing); CF: formal analysis, data curation, methodology, supervision, funding acquisition, and writing (review and editing); MG: conceptualization, supervision, project administration, funding acquisition, writing (review and editing), and visualization.
References
AAEA (2000). Commodity Costs and Returns Estimation Handbook. United States Department of Agriculture, Washington, D.C. http://ageconsearch.umn.edu.
ABARES (2024). Farm surveys definitions and methods, Departement of Agriculture, Fisheries, and Forestry, Australian Government, Canberra. https://www.agriculture.gov.au/abares/research-topics/surveys/farm-definitions-methods#references.
Allain E., Laurin C. (2018). Explaining implementation difficulties associated with activity-based costing through system uses. Journal of Applied Accounting Research, 19(1): 181-198. DOI: https://doi.org/10.1108/JAAR-11-2014-0120.
Amat C., Michalski T.K., Stoltz G. (2014). Forecasting exchange rates better than the random walk thanks to machine learning techniques. SSRN Electronic Journal. DOI: https://doi.org/10.2139/ssrn.2448655.
Antonioli F., Severini S., Vigani M. (2023). Visa for competitiveness: Foreign workforce and Italian dairy farms’ performance. European Review of Agricultural Economics, 50(1): 115-150. DOI: https://doi.org/10.1093/erae/jbab045.
Arendonk J.A.M., van Liinamo A.-E. (2003). Dairy cattle production in Europe. Theriogenology, 59(2): 563-569. DOI: https://doi.org/10.1016/S0093-691X(02)01240-2.
Atzori A.S., Valsecchi C., Manca E., Masoero F., Cannas A., Gallo A. (2021). Assessment of feed and economic efficiency of dairy farms based on multivariate aggregation of partial indicators measured on field. Journal of Dairy Science, 104(12): 12679-12692. DOI: https://doi.org/10.3168/jds.2020-19764.
Beber C.L., Langer G., Meyer J. (2021). Strategic actions for a sustainable internationalization of agri-food supply chains: The case of the dairy industries from Brazil and Germany. Sustainability, 13(19), 10873. DOI: https://doi.org/10.3390/su131910873.
Belloin J.C. (1998). Milk and dairy products: Production and processing costs, Food and Agriculture Orzanization of the United Nations, Rome. https://www.fao.org/4/x6931e/X6931E00.htm#TOC.
Berg M., Moore G. (1989). The choice of depreciation method under uncertainty. Decision Sciences, 20(4): 643-654. DOI: https://doi.org/10.1111/j.1540-5915.1989.tb01409.x.
Bernardes T.F., do Rêgo A.C. (2014). Study on the practices of silage production and utilization on Brazilian dairy farms. Journal of Dairy Science, 97(3): 1852-1861. DOI: https://doi.org/10.3168/jds.2013-7181.
Biden S., Ker A.P., Duff S. (2020). Impacts of trade liberalization in Canada’s supply managed dairy industry. Agricultural Economics, 51(4): 535-552. DOI: https://doi.org/10.1111/agec.12570.
Biesebroeck J.V. (2009). Disaggregate productivity comparisons: Sectoral convergence in OECD countries. Journal of Productivity Analysis, 32(2): 63-79. DOI: https://doi.org/10.1007/s11123-009-0132-z.
Bimbo F., Bonanno A., Liu X., Viscecchia R. (2016). Hedonic analysis of the price of UHT-treated milk in Italy. Journal of Dairy Science, 99(2): 1095-1102. DOI: https://doi.org/10.3168/jds.2015-10018.
Britt J.H., Cushman R.A., Dechow C.D., Dobson H., Humblot P., Hutjens M.F., Jones G.A., Ruegg P.S., Sheldon I.M., Stevenson J.S. (2018). Invited review: Learning from the future—A vision for dairy farms and cows in 2067. Journal of Dairy Science, 101(5): 3722-3741. DOI: https://doi.org/10.3168/jds.2017-14025.
Brunk I. (Wuerth), Hakimi M. (2022). Russia, Ukraine, and the future world order. American Journal of International Law, 116(4): 687-697. DOI: https://doi.org/10.1017/ajil.2022.69.
Bureau J.C., Butault J.-P. (1992). Productivity gaps, price advantages and competitiveness in E.C. agriculture. European Review of Agricultural Economics, 19(1): 25-48. DOI: https://doi.org/10.1093/erae/19.1.25.
Canadian Dairy Commission (2024). Cost of production survey, Canadian Dairy Commission, Ottawa. https://cdc-ccl.ca/node/643.
Chamberlain T. (2012). Understanding the economics of dairy farming. Part 2: Identifying the factors that drive profitability. Livestock, 17(6): 25-28. DOI: https://doi.org/10.1111/j.2044-3870.2012.00150.x.
Chatellier V. (2021). Review: International trade in animal products and the place of the European Union: Main trends over the last 20 years. Animal, 15, 100289. DOI: https://doi.org/10.1016/j.animal.2021.100289.
CLAL.IT (2024). Dairy by country, CLAL Srl, Sermide e Felonica. https://www.clal.it/en/index.php.
Coffey E.L., Horan B., Evans R.D., Berry D.P. (2016). Milk production and fertility performance of Holstein, Friesian, and Jersey purebred cows and their respective crosses in seasonal-calving commercial farms. Journal of Dairy Science, 99(7): 5681-5689. DOI: https://doi.org/10.3168/jds.2015-10530.
CONAB (2020). Norma metodologia do custo de produção 30.302, Companhia Nacional de Abastecimento, Brasília. https://www.conab.gov.br/images/arquivos/normativos/30000_sistema_de_operacoes/30.302_Norma_Metodologia_de_Custo_de_Producao.pdf.
Conigliani C., Tancredi A. (2009). A Bayesian model averaging approach for cost‐effectiveness analyses. Health Economics, 18(7): 807-821. DOI: https://doi.org/10.1002/hec.1404.
Correa-Luna M., Donaghy D., Kemp P., Shalloo L., Ruelle E., Hennessy D., López-Villalobos N. (2021). Productivity, profitability and nitrogen utilisation efficiency of two pasture-based milk production systems differing in the milking frequency and feeding level. Sustainability, 13(4), 2098. DOI: https://doi.org/10.3390/su13042098.
DairyAustralia (2024). Dairy farm monitor project, Diary Australia, Melbourne. https://www.dairyaustralia.com.au/industry-reports/dairy-farm-monitor-project.
DairyNZ (2024). Farm economics, DairyNZ, Hamilton. https://connect.dairynz.co.nz/content/89ba1084-42c5-4786-882b-cc91b8016d05/.
Dillon P., Hennessy T., Shalloo L., Thorne F., Horan B. (2008). Future outlook for the Irish dairy industry: A study of international competitiveness, influence of international trade reform and requirement for change. International Journal of Dairy Technology, 61(1): 16-29. https://doi.org/10.1111/j.1471-0307.2008.00374.x
Dobson W.D., Wagner J. (2000). The deregulation and rationalization of Australia’s dairy industry-Implications for the U.S. and world dairy industries, University of Wisconsin-Madison, Babcock Institute for International Dairy Research and Development, Madison. DOI: https://doi.org/10.22004/ag.econ.37661.
Edwards J.P. (2020). A comparison of profitability between farms that milk once or twice a day. Animal Production Science, 60(1): 102. DOI: https://doi.org/10.1071/AN18528.
EMB (2021). Milk production costs in eight European countries, EU average costs and organic milk production costs What is the cost of producing milk?, European Milk Board, Brussels. www.milcherzeuger.eu.
European Commission (2021). EU dairy farms report based on 2018 FADN data, European Commision. https://agriculture.ec.europa.eu/document/download/19e9af1c-82af-4e95-8c3a-8df09dafd2f9_en?filename=fadn-dairy-report-2021_en.pdf.
FAO (2016). Agricultural cost of production statistics guidelines for data collection, compilation and dissemination publication prepared in the framework of the Global Strategy to Improve Agricultural and Rural Statistics. Food and Agriculture Organization, Rome.
FAO (2023). Dairy market review: Emerging trends and outlook in 2023, Food and Agriculture Organization, Rome. https://openknowledge.fao.org/server/api/core/bitstreams/68f7f25d-b3cb-418e-b04d-5708e5bcea1e/content.
FAOSTAT (2025). Producer prices, Food and Agriculture Organization of the United Nations, Rome. https://www.fao.org/faostat/en/#data/PP.
Freitas A.F., Wilcox C.J., Costa C.N. (1998). Breed group effects on milk production of Brazilian crossbred dairy cows. Journal of Dairy Science, 81(8): 2306-2311. DOI: https://doi.org/10.3168/jds.S0022-0302(98)75811-4.
Freitas E.N.A., Cabrera V.E. (2025). Dairy Victory Platform: A novel benchmarking platform to empower economic decisions on dairy farms. JDS Communications, 6(1): 69-73. DOI: https://doi.org/10.3168/jdsc.2024-0617.
Frengley G.A.G., Johnston W.E. (1992). Financial stress and consumption expectations among farm households: New Zealand’s experience with economic liberalisation. Journal of Agricultural Economics, 43(1): 14-27. DOI: https://doi.org/10.1111/j.1477-9552.1992.tb00194.x.
Hagan B.A., Moro-Mendez J., Cue R.I. (2021). Realized genetic selection differentials in Canadian Ayrshire, Jersey, and Brown Swiss dairy cattle populations. Journal of Dairy Science, 104(2): 1951-1966. DOI: https://doi.org/10.3168/jds.2019-17938.
Harris B.L. (2005). Breeding dairy cows for the future in New Zealand. New Zealand Veterinary Journal, 53(6): 384-389. DOI: https://doi.org/10.1080/00480169.2005.36582.
Hegazi M.O. (2024). A novel approach for simulating and optimizing the production costing system. Heliyon, 10(24), e40932. DOI: https://doi.org/10.1016/j.heliyon.2024.e40932.
Hemme T., Uddin M.M., Ndambi O.A. (2014). Benchmarking cost of milk production in 46 countries. Journal of Reviews on Global Economics, 3: 254-270. DOI: https://doi.org/10.6000/1929-7092.2014.03.20.
IFCN Dairy Network (2018). IFCN dairy report 2021: The dairy research network, The International Farm Comparison Network, Kiel. https://ifcndairy.org/ifcn-products-services/dairy-report/.
IFCN Dairy Network (2022). IFCN dairy report 2021: The dairy research network, The International Farm Comparison Network, Kiel. https://ifcndairy.org/ifcn-products-services/dairy-report/.
Inna B., Tetiana Y., Anatolii B., Oleksandr K., Liudmyla Y., Svitlana B. (2024). Features of enterprise cost management. In Alareeni B., Elgedawy I. (eds) Opportunities and Risks in AI for Business Development. Studies in Systems, Decision and Control, vol. 545 (pp. 699-709). Springer, Cham. DOI: https://doi.org/10.1007/978-3-031-65203-5_61.
Jayawardana J.M.D.R., Lopez-Villalobos N., Hickson R.E., McNaughton L.R. (2023). Estimation of genetic parameters and individual and maternal breed, heterosis, and recombination loss effects for production and fertility traits of spring-calved cows milked once daily or twice daily in New Zealand. Journal of Dairy Science, 106(1): 364-380. DOI: https://doi.org/10.3168/jds.2022-22053
Kamal S., Noy I. (2023). Impact of droughts on farms’ financing choices: Empirical evidence from New Zealand. Weather, Climate, and Society, 15(1): 121-132. DOI: https://doi.org/10.1175/WCAS-D-21-0193.1.
Kondaridze M., Liu X., Luckstead J. (2025). Dairy trade reconsidered: Gravity and the distributional effect of non‐tariff barriers and distance. Agricultural Economics, 57(1), e70081. DOI: https://doi.org/10.1111/agec.70081.
Kondaridze M., Luckstead J. (2023). Determinants of dairy‐product trade: Do subsidies matter? Journal of Agricultural Economics, 74(3): 857-873. DOI: https://doi.org/10.1111/1477-9552.12536.
Krupová Z., Krupa E., Michaličková M., Wolfová M., Kasarda R. (2016). Economic values for health and feed efficiency traits of dual-purpose cattle in marginal areas. Journal of Dairy Science, 99(1): 644-656. DOI: https://doi.org/10.3168/jds.2015-9951.
Langley S.V., Somwaru A., Normile M.A. (2006). Trade liberalization in international dairy markets: Estimated impacts, Economic Research Report Number 16, United States Department of Agriculture, Washington, D.C. DOI: https://doi.org/10.22004/AG.ECON.7214.
Langrell S., Ciaian P., Paloma S.G., Cunningham D.L., Garnier J.-F., Isermeyer F., Mishra A.K. (2012). Sustainability and production costs in the global farming sector: Comparative analysis and methodologies. European Commission.
Lazzarini B., Lopez-Villalobos N., Lyons N., Hendrikse L., Baudracco J. (2018). Productive, economic and risk assessment of grazing dairy systems with supplemented cows milked once a day. Animal, 12(5): 1077-1083. DOI: https://doi.org/10.1017/S1751731117002853.
Lozada-Soto E.A., Tiezzi F., Jiang J., Cole J.B., VanRaden P.M., Maltecca C. (2022). Genomic characterization of autozygosity and recent inbreeding trends in all major breeds of US dairy cattle. Journal of Dairy Science, 105(11): 8956-8971. DOI: https://doi.org/10.3168/jds.2022-22116.
Luo J., Ledgard S. (2021). New Zealand dairy farm systems and key environmental effects. Frontiers of Agricultural Science and Engineering, 8(1): 148. DOI: https://doi.org/10.15302/J-FASE-2020372.
McLachlan B.A., Van Kooten G.C. (2022). Reforming Canada’s dairy supply management scheme and the consequences for international trade. Canadian Journal of Agricultural Economics/Revue Canadienne d’agroeconomie, 70(1): 21-39. DOI: https://doi.org/10.1111/cjag.12305.
McNown R., Wallace M.S. (1989). National price levels, purchasing power parity, and cointegration: A test of four high inflation economies. Journal of International Money and Finance, 8(4): 533-545. DOI: https://doi.org/10.1016/0261-5606(89)90035-1.
Milić D., Novaković T., Tekić D., Matkovski B., Đokić D., Zekić S. (2023). Economic sustainability of the milk and dairy supply chain: Evidence from Serbia. Sustainability, 15(21), 15234. DOI: https://doi.org/10.3390/su152115234.
Murphy J.P., O’Donovan M., McCarthy K., Delaby L., Sugrue K., Galvin N., Murphy C., Kennedy E. (2023). A three-year comparison of once-a-day and twice-a-day milking in seasonal-calving pasture-based systems. Journal of Dairy Science, 106(12): 8910-8925. DOI: https://doi.org/10.3168/jds.2023-23379.
Mykrantz J.L., Bozic M. (2022). Opportunity cost: An economic concept that may improve the functioning of federal milk marketing orders and the U.S. dairy industry. Journal of Agricultural and Applied Economics, 54(4): 606-620. DOI: https://doi.org/10.1017/aae.2022.29.
Negrín M.A., Vázquez-Polo F.-J. (2008). Incorporating model uncertainty in cost-effectiveness analysis: A Bayesian model averaging approach. Journal of Health Economics, 27(5): 1250-1259. DOI: https://doi.org/10.1016/j.jhealeco.2008.03.005.
Nguyen T.T.T., Bowman P.J., Haile-Mariam M., Nieuwhof G.J., Hayes B.J., Pryce J.E. (2017). Short communication: Implementation of a breeding value for heat tolerance in Australian dairy cattle. Journal of Dairy Science, 100(9): 7362-7367. DOI: https://doi.org/10.3168/jds.2017-12898.
Ocean N., Howley P. (2023). Which benefits would make farmers happier, and which would they choose? Land Economics, 99(3): 458-476. DOI: https://doi.org/10.3368/le.99.3.112321-0139R.
Ohlan R. (2014). Growth and instability in dairy production and trade: A global analysis. International Journal of Trade and Global Markets, 7(2): 145. DOI: https://doi.org/10.1504/IJTGM.2014.062856.
Oliveira H.R., Lourenco D.A.L., Masuda Y., Misztal I., Tsuruta S., Jamrozik J., Brito L. F., Silva F.F., Cant J.P., Schenkel F.S. (2019). Single-step genome-wide association for longitudinal traits of Canadian Ayrshire, Holstein, and Jersey dairy cattle. Journal of Dairy Science, 102(11): 9995-10011. DOI: https://doi.org/10.3168/jds.2019-16821.
Ozawa T., Lopez-Villalobos N., Blair H.T. (2005). Dairy farming financial structures in Hokkaido, Japan and New Zealand. Animal Science Journal, 76(4): 391-400. DOI: https://doi.org/10.1111/j.1740-0929.2005.00281.x.
Pant H.M., Fisher B.S. (2007). Alternative measures of output in global economic-environmental models: Purchasing power parity or market exchange rates? —Comment. Energy Economics, 29(3): 375-389. DOI: https://doi.org/10.1016/j.eneco.2006.10.006.
Parzonko A., Parzonko A.J., Bórawski P. (2024). Economic competitiveness of dairy farms from the top milk-producing countries in the EU: Assessment in 2014-2021. Agriculture (Switzerland), 14(1). DOI: https://doi.org/10.3390/agriculture14010123.
Phillipov M., Loyer J. (2019). In the wake of the supermarket ‘milk wars’: Media, farmers and the power of pastoral sentimentality. Discourse, Context Media, 32, 100346. DOI: https://doi.org/10.1016/j.dcm.2019.100346.
Probo M., Atashi H., Hostens M. (2024). Lactation performances in primiparous Holstein cows following short and normal gestation lengths. Frontiers in Veterinary Science, 11. DOI: https://doi.org/10.3389/fvets.2024.1289116.
Quesado P., Silva R. (2021). Activity-based costing (ABC) and its implication for open innovation. Journal of Open Innovation: Technology, Market, and Complexity, 7(1): 41. DOI: https://doi.org/10.3390/joitmc7010041.
Reeson A.F., McAllister R.R.J., Whitten S.M., Gordon I.J., Nicholas M., McDouall S.S. (2008). The agistment market in the northern Australian rangelands: Failings and opportunities. The Rangeland Journal, 30(3): 283. DOI: https://doi.org/10.1071/RJ06042.
Ronzon T., Ciaian P., Paloma S.G., Delince J. (2014). Literature review on cost of production methodologies, Technical Paper Series GO-04-2014. DOI: https://doi.org/10.13140/RG.2.2.30101.12008.
Ruzzante S., Labarta R., Bilton A. (2021). Adoption of agricultural technology in the developing world: A meta-analysis of the empirical literature. World Development, 146, 105599. DOI: https://doi.org/10.1016/j.worlddev.2021.105599.
Sanjuán A.I., Philippidis G., Ferrer Pérez H., Gracia De Rentería P. (2023). Empirical insights on the dynamics of SPS trade costs: The role of regulatory convergence and experience in EU dairy trade. Food Policy, 119, 102524. DOI: https://doi.org/10.1016/j.foodpol.2023.102524.
Sercu P., Uppal R., Hulle C.V. (1995). The exchange rate in the presence of transaction costs: Implications for tests of purchasing power parity. The Journal of Finance, 50(4): 1309. DOI: https://doi.org/10.2307/2329354.
Smith B.J. (1974). Estimating comparative costs of producing milk among the Southern states. Journal of Agricultural and Applied Economics, 6(1): 221-228. DOI: https://doi.org/10.1017/S0081305200011754.
Špička J., Dereník P. (2021). How opportunity costs change the view on the viability of farms? Empirical evidence from the EU. Agricultural Economics (Zemědělská Ekonomika), 67(2): 41-50. DOI: https://doi.org/10.17221/412/2020-AGRICECON.
Stanbury W.T. (2002). The politics of milk in Canada, The Fraser Institute, Vancouver. https://www.fraserinstitute.org/sites/default/files/PoliticsofMilkinCanada.pdf.
Stirm J.E.W., St-Pierre N.R. (2003). Identification and characterization of location decision factors for relocating dairy farms. Journal of Dairy Science, 86(11): 3473-3487. DOI: https://doi.org/10.3168/jds.S0022-0302(03)73952-6.
Thomassen M.A., Dolman M.A., van Calker K.J., de Boer I J.M. (2009). Relating life cycle assessment indicators to gross value added for Dutch dairy farms. Ecological Economics, 68(8-9): 2278-2284. DOI: https://doi.org/10.1016/j.ecolecon.2009.02.011.
Tian R., Yang Z., Shao Q. (2020). Effects of host country resource endowment and labour cost on China’s investment in overseas cultivated land. Environmental Science and Pollution Research, 27(36): 45282-45296. DOI: https://doi.org/10.1007/s11356-020-10373-3.
Upton J., Murphy M., de Boer I.J.M., Koerkamp P.W.G.G., Berentsen P.B.M., Shalloo L. (2015). Investment appraisal of technology innovations on dairy farm electricity consumption. Journal of Dairy Science, 98(2): 898-909. DOI: https://doi.org/10.3168/jds.2014-8383.
USDA (2024). Milk cost of production estimates, United States Department of Agriculture, Washington, D.C. https://www.ers.usda.gov/data-products/milk-cost-of-production-estimates/.
Viira A.-H., Põder A., Värnik R. (2009). The factors affecting the motivation to exit farming - Evidence from Estonia. Food Economics - Acta Agriculturae Scandinavica, Section C, 6(3-4): 156-172. DOI: https://doi.org/10.1080/16507541.2010.481899.
Weigel K.A., Rekaya R., Zwald N.R., Fikse W.F. (2001). International genetic evaluation of dairy sires using a multiple-trait model with individual animal performance records. Journal of Dairy Science, 84(12): 2789-2795. DOI: https://doi.org/10.3168/jds.S0022-0302(01)74734-0.
Williamson J.M., Stutzman S. (2016). Tax policy and farm capital investment: Section 179 expensing and bonus depreciation. Agricultural Finance Review, 76(2): 246-269. DOI: https://doi.org/10.1108/AFR-07-2015-0031.
World Bank. (2025). Data Bank World Development Indicators, World Bank Group, Washinton, D.C. https://databank.worldbank.org/metadataglossary/world-development-indicators/series/PA.NUS.PPP.
Zanon T., Fichter G., Mittermair P., Nocker L., Gauly M., Peratoner G. (2023). Quantifying methane emissions under field conditions under 2 different dairy production scenarios: Low-input versus high-input milk production. Journal of Dairy Science, 106(7): 4711-4724. DOI: https://doi.org/10.3168/jds.2022-22804.
Zanon T., König S., Gauly M. (2020). A comparison of animal-related figures in milk and meat production and economic revenues from milk and animal sales of five dairy cattle breeds reared in Alps region. Italian Journal of Animal Science, 19(1): 1318-1328. DOI: https://doi.org/10.1080/1828051X.2020.1839361.
Ziętara W., Pietrzak M., Malak-Rawlikowska A. (2024). Polish dairy farm transformations and competitiveness 20 years after Poland’s accession to the European Union. Animals, 14(13), 2013. DOI: https://doi.org/10.3390/ani14132013.
Appendix
| Country | Currency | Milk cost unit | Year | USD Exchange | %Fat | %CP | PPI | PPP |
|---|---|---|---|---|---|---|---|---|
| EU27 | EUR | ton | 2018 | 0.848 | 4.02 | 3.47 | 102.56 | N.A. |
| 2019 | 0.893 | 4.06 | 3.47 | 104.08 | N.A. | |||
| 2020 | 0.880 | 4.09 | 3.43 | 102.49 | N.A. | |||
| 2021 | 0.846 | 4.10 | 3.43 | 114.11 | N.A. | |||
| Germany | EUR | ton | 2018 | 0.848 | 4.06 | 3.68 | 111.95 | 0.70 |
| 2019 | 0.893 | 4.13 | 3.66 | 109.09 | 0.70 | |||
| 2020 | 0.880 | 4.13 | 3.47 | 109.47 | 0.70 | |||
| 2021 | 0.846 | 4.15 | 3.46 | 115.43 | 0.70 | |||
| France | EUR | ton | 2018 | 0.848 | 4.01 | 3.38 | 104.22 | 0.80 |
| 2019 | 0.893 | 4.06 | 3.46 | 108.32 | 0.70 | |||
| 2020 | 0.880 | 4.07 | 3.27 | 107.24 | 0.70 | |||
| 2021 | 0.846 | 4.09 | 3.27 | 111.83 | 0.70 | |||
| Netherlands | EUR | ton | 2018 | 0.848 | 4.37 | 3.55 | 99.91 | 0.80 |
| 2019 | 0.893 | 4.42 | 3.57 | 101.08 | 0.80 | |||
| 2020 | 0.880 | 4.42 | 3.58 | 92.30 | 0.70 | |||
| 2021 | 0.846 | 4.45 | 3.59 | 101.83 | 0.70 | |||
| Poland | EUR | ton | 2018 | 0.848 | 3.95 | 3.26 | 111.76 | 1.70 |
| 2019 | 0.893 | 3.98 | 3.26 | 112.34 | 1.70 | |||
| 2020 | 0.880 | 4.05 | 3.31 | 114.75 | 1.70 | |||
| 2021 | 0.846 | 4.10 | 3.31 | 130.28 | 1.70 | |||
| Italy | EUR | ton | 2018 | 0.848 | 3.71 | 3.37 | 100.57 | 0.70 |
| 2019 | 0.893 | 3.65 | 3.36 | 107.83 | 0.60 | |||
| 2020 | 0.880 | 3.77 | 3.45 | 98.87 | 0.60 | |||
| 2021 | 0.846 | 3.76 | 3.44 | 103.44 | 0.60 | |||
| Ireland | EUR | ton | 2018 | 0.848 | 4.10 | 3.58 | 116.15 | 0.80 |
| 2019 | 0.893 | 4.17 | 3.65 | 111.46 | 0.80 | |||
| 2020 | 0.880 | 4.20 | 3.55 | 112.93 | 0.80 | |||
| 2021 | 0.846 | 4.23 | 3.55 | 131.26 | 0.80 | |||
| US | USD | cwt | 2018 | N.A. | 3.89 | 3.00 | 84.78 | 1.00 |
| 2019 | N.A. | 3.92 | 3.37 | 97.02 | 1.00 | |||
| 2020 | N.A. | 3.95 | 3.18 | 95.04 | 1.00 | |||
| 2021 | N.A. | 4.01 | 3.20 | 96.55 | 1.00 | |||
| Canada | CAD | hectoliter | 2018 | 1.298 | 3.96 | 3.30 | 96.28 | 1.20 |
| 2019 | 1.327 | 4.03 | 3.30 | 101.31 | 1.20 | |||
| 2020 | 1.344 | 4.05 | 3.32 | 101.98 | 1.20 | |||
| 2021 | 1.254 | 4.07 | 3.34 | 104.14 | 1.20 | |||
| Brazil | BRL | liter | 2018 | 3.666 | 3.90 | 3.30 | 100.86 | 2.20 |
| 2019 | 3.943 | 3.90 | 3.30 | 107.54 | 2.20 | |||
| 2020 | 5.137 | 3.90 | 3.30 | 142.85 | 2.30 | |||
| 2021 | 5.397 | 3.90 | 3.30 | 173.01 | 2.40 | |||
| Australia | AUD | kg MS | 2018 | 1.343 | 4.00 | 3.30 | 102.39 | 1.50 |
| 2019 | 1.438 | 3.83 | 3.35 | 96.67 | 1.50 | |||
| 2020 | 1.460 | 4.04 | 3.39 | 96.94 | 1.40 | |||
| 2021 | 1.332 | 4.01 | 3.40 | 102.30 | 1.40 | |||
| New Zealand | NZD | kg MS | 2018 | 1.450 | 4.86 | 3.87 | 120.71 | 1.50 |
| 2019 | 1.517 | 4.82 | 3.89 | 114.42 | 1.40 | |||
| 2020 | 1.548 | 4.84 | 3.92 | 123.44 | 1.40 | |||
| 2021 | 1.415 | 4.84 | 3.92 | 128.90 | 1.50 |