Research article
Entrepreneurial profiles of Italian professional farms
CREA – Research Centre for Agricultural Policies and Bioeconomy, Italy
*Corresponding author. E-mail: roberta.sardone@crea.gov.it
Abstract. This paper analyses the prevailing entrepreneurial profiles within Italy’s professional agricultural sector, using data from the 7th Italian National Institute of Statistics (ISTAT) Agricultural Census, 2020. Access to micro-data from the complete spectrum of Italian farms allowed us to perform to an extensive analysis of the entrepreneurial profiles. Moving from market-oriented farms with stable market relationships and a minimum threshold of economic production, we identified nine distinct profiles by using hierarchical cluster analysis and a set of structural and managerial indicators supported by the current literature. These profiles vary significantly in terms of the age of farmers, the economic size of farms, the type of farming, human capital, and strategic orientation. The age of farmers is a particularly powerful variable to discriminate among the entrepreneurial profiles. Although young farmers are often more innovative than older ones, the spectrum of entrepreneurship is wide and diverse, especially regarding the diversification of activities. Our results confirm a complex picture of farm management in Italy, where corporate businesses integrated into the agro-food system coexist with small farms and part-time farmers. Such representation calls for more targeted public support policies that address specific needs and potential role of different types of farmers.
Keywords: Italian agriculture, census, entrepreneurial profiles, market-oriented farms, cluster analysis.
JEL codes: Q10, Q12, Q13.
Index
3.2. Presentation and discussion of the entrepreneurial profiles
3.3. Comparative analysis of the entrepreneurial profiles
4. Conclusions and future research
– We identified nine distinct entrepreneurial profiles, ranging from innovative to more traditional farmers.
– Some profiles have a greater propensity for innovation and diversification, but the prevalent profile in Italian agriculture shows a low to medium entrepreneurial attitude.
– Generational renewal does not automatically lead to innovation; some young farmers appear to align with less innovative agricultural businesses.
– The findings confirm that there is a diverse array of farm types in Italy and suggest there is a potential mismatch with current public support policies.
Entrepreneurship in agriculture is a complex issue that encompasses multiple theoretical definitions. It moves from the standard definition given by non-economists and includes empirical aspects related to the behaviour, knowledge, skills, and ability of entrepreneurs to interact with society. The central element is a subject who identifies and evaluates business development opportunities and makes the appropriate decisions to pursue them (Lans et al., 2013). Unlike the classic objectives of profit maximisation and production efficiency, contemporary agricultural entrepreneurs have broadened their decision-making set of choices by adapting resources to respond effectively to growing socio-economic and environmental pressures and challenges. While this is evident in contemporary farm organisation, the objectives of entrepreneurs depend on the type of entrepreneur who manages the on-farm activities (McElwee, 2008; McElwee et al., 2012; Milone, 2024).
Recent theoretical frameworks of new entrepreneurship in agriculture have emphasised changes and strategies that have emerged as a response to integrated production systems which primarily support global value chains. These frameworks have identified a wide spectrum of strategies and production factors that reflect the role of agricultural activities in rural areas, the physical and economic sizes of farms, the range of income diversification in favour of on-farm activities, and the perspective of a generational renewal of farm holders (Herman, 2025; Salvioni et al., 2020). Moreover, social and environmental concerns are becoming a key part of decision-making, so economic returns are no longer the only driver in the entrepreneurial approach to agriculture (Seuneke et al., 2013; Poponi et al., 2021; Passaro, Randelli, 2022). This new entrepreneurship aims to create novel production modes based on product differentiation, activity diversification, collective action, and proximity relationships (Dias et al., 2019; Condor, 2020). This theoretical framework is consistent with Italian agriculture, which is characterised by great diversity in terms of the form and scope: from self-consuming micro-farms to corporate businesses integrated into the agri-food system. This is also consistent with the European model of agriculture, which features the coexistence of business models based on diversified farms, mostly family-run and part time, producing a wide range of differentiated products (Cardwell, 2004; Korkeaoja, 2006). However, in our view the prevailing and coexisting entrepreneurial models in Italian agriculture have been long neglected and need to be better explored in the light of the deep changes occurring in the primary sector and in rural areas, as demonstrated by long-term changes reported by several authors (Fabiani, Scarano, 1995; Fanfani, 2008; Sardone, 2012; Sotte, Arzeni, 2014; Henke, Sardone, 2020). The 7th Italian National Institute of Statistics (ISTAT) Agricultural Census, 2020, has provided an updated and detailed picture of the agricultural sector in Italy, allowing for a deeper analysis of its complex entrepreneurial landscape (Dias et al., 2019).
As highlighted in a systematic review of entrepreneurship in agriculture (Condor, 2020), there are different streams of the literature based on the concepts of structural changes and business diversification. Since the 1990s, many researchers have shown how small family farms have the same entrepreneurial skills as other larger businesses. Other studies have focused on the external factors affecting farm entrepreneurship, such as the diversification of activities and the supply of services, which became a challenge for farmers and their families. In Italy, we can identify three main waves of studies focusing on the issue of agricultural entrepreneurship. The first wave has used the ISTAT Agricultural Census to investigate how Italian agriculture has transformed over time, with specific attention to its structural and entrepreneurial changes (Barbero, 1982; Fabiani, Scarano, 1995; Russo, Sabbatini, 2005). Most of these studies explained the differences in farm structures and entrepreneurial behaviours in terms of physical and economic sizes, labour, product specialisation. The second wave focused on specific structural dynamics of Italian farms, especially on innovation, multifunctionality; and the relationships between primary productions and production of public goods and eco-services, and relative support policies (Rete Rurale Nazionale, 2011; Devitiis, Maietta, 2013; Salvioni et al., 2013; Vanni, 2013; Arzeni, Sotte, 2014). The inclusion of new economic, social, and environmental variables from the census has enriched our understanding of territorial differences, particularly concerning market relationships and the functional diversification of on-farm activities. These expanded datasets, whether policy driven or focused on territorial disparities, have recently spurred numerous studies on agricultural entrepreneurship, representing the third wave of studies (Mantino, Vanni, 2018; Salvioni et al., 2020; Henke, Sardone, 2022).
The 7th ISTAT Agricultural Census from 2020 has further broadened the spectrum of data, introducing new information which helps to complete the picture of changes in Italian agriculture. These new relevant elements include diversification, generational change, and the level of sustainability in agriculture (Henke, Sardone, 2022; Licciardo et al., 2023; Gismondi, 2024).
In Italy, 93% of farms are run by individual families. Their activity is linked to a diverse array of demographic, structural, economic, environmental, and social factors. It is crucial to investigate the diversity of agricultural entrepreneurs operating in Italian farms (based on these factors) and the actions they take to produce both private and public goods. Therefore, this study aimed to identify and discuss the prevailing entrepreneurship profiles in professional Italian agriculture, utilising the new elements offered by the 7th ISTAT Agricultural Census, adopting selective criteria to focus on farms with stable market relationships. The identification of prevailing and emerging entrepreneurial profiles in market-oriented (or professional) agriculture is relevant not only for scientific purposes, but also for a better understanding of the structural changes occurring in the Italian agricultural sector, following the main dynamics of the European model of agriculture. This in-depth analysis is relevant to connect the main features of contemporary professional agriculture, decisions about on-farm activities, and management, providing comprehensive data on on-going evolution, and targeting agricultural policies. It is worth noting that the identification of main entrepreneurial profiles moving from micro-data collected by the 7th ISTAT Agricultural Census rather than from ad hoc surveys or interviews is rather innovative and requires extensive preliminary work regarding data selection, elaboration, and stratification. Nevertheless, we think that the results are meaningful and contribute to advance the knowledge in the field and support analysis for policy design and implementation.
Before describing the methodology used in this study, it is necessary to describe the two concepts on which this analysis is based: market-oriented farms (MOFs) and the level of entrepreneurship. MOFs have a prevalent economic objective: to obtain from product and service sales1 an income that is adequate to support at least the farm manager. We can therefore assume that these farmers have an entrepreneurial approach to business management, which involves strategic decisions to achieve the economic objective. The level of entrepreneurship increases as the complexity and risk related to these choices increase. For example, those who make innovative investments have a greater propensity to take risks in their business. Based on this consideration and our review of the literature (see citations in Section 2.2 and Table 1), we identified several variables associated with different levels of entrepreneurship. They are shown in the last column of Table A.1.
Differently from other contributions (e.g. Weltin et al., 2017; Graskemper, 2021a), we applied our methodology to the entire agricultural farm population based on the micro-data collected by the 7th ISTAT Agricultural Census. Our combination of micro-data and a multivariate approach allowed us to examine entrepreneurial diversity of Italian agriculture in depth. These insights could inform future research that uses more sophisticated methodologies.
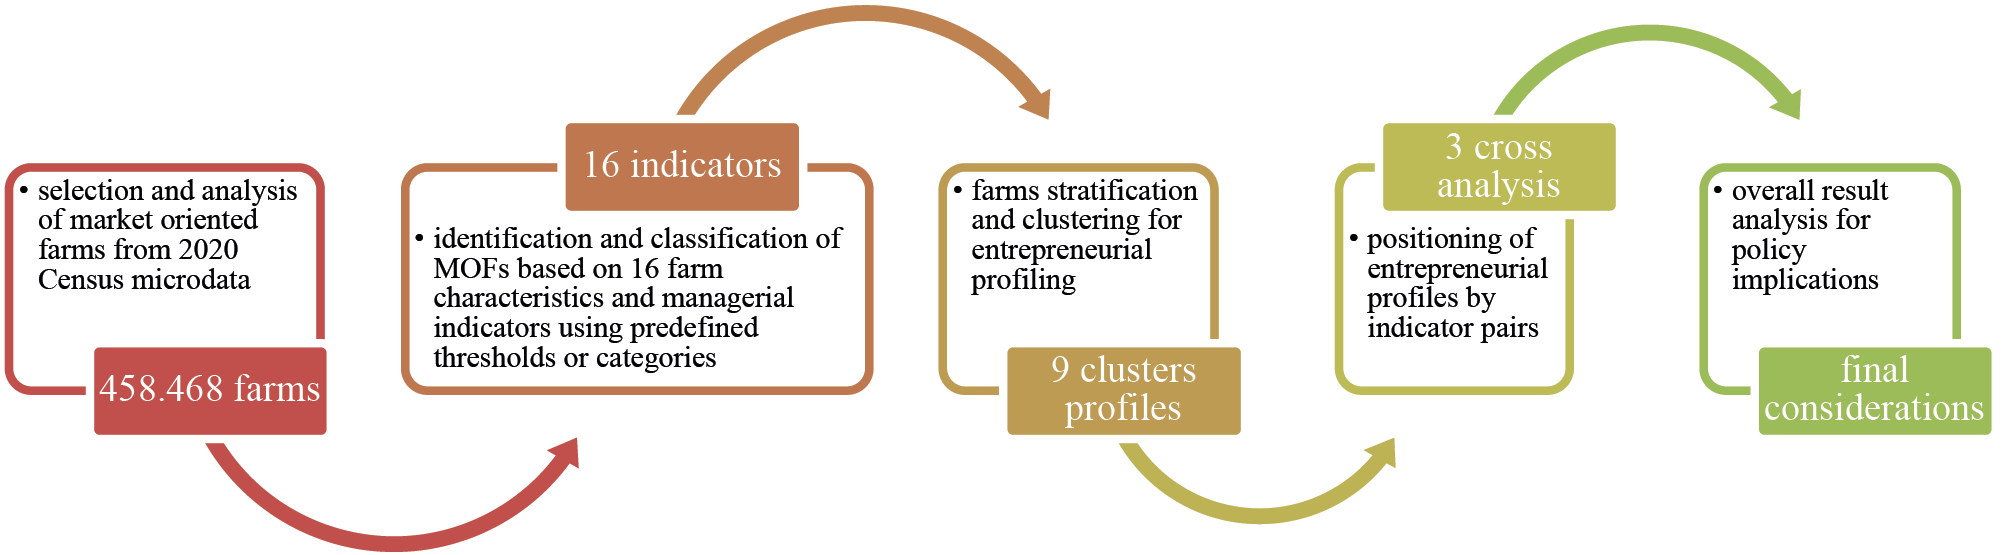
Figure 1 illustrates our methodological approach and the data flow followed in this study. We identified and classified MOFs by using a set of indicators of entrepreneurial characteristics and behaviours and then associated each group with a distinct entrepreneurial profile. Finally, we compared the profiles were compared to each other to highlight their similarities and differences.
The analysis is based on the micro-data2 of the 7th ISTAT Agricultural Census, which includes 1,133,006 farms nationwide. The census questionnaire consists of eight sections to collect information on land use, the type and size of livestock farms and their management, environmental considerations, the presence and type of other gainful activities, the characteristics of the farm manager, generational renewal, marketing of farm products, workforce, digitalisation, and innovation, among others. Therefore, the collected data are mainly structural in nature, but the census also provides valuable classifications of farms based on economic size and farming type.
We selected the specific variables used in this study from more than 600 items in the census questionnaire. Of these, approximately 400 items are strictly agronomic, relating to the species cultivated and the breeds raised, as well as to certain purely technical aspects. Many values are missing among the remaining variables: only about 150 items remained effectively usable, including the various response modalities, such as over 20 options for farm diversification activities.
We excluded farms with a standard output (SO) of <8,000 euros, as these are considered non-commercial holdings (non-market-oriented) and mainly oriented towards social strategies (Rete Rurale Nazionale, 2011; Condor, 2020). Thus, we focused on MOFs which (i) sell their products/services on the market, including each possible channel; (ii) consume less than 100% of their products; and (iii) have a minimum SO of 8,000 euros (Figure 1). While only 40.5% of the farms recorded by the census are MOFs, they represent a larger share of the utilised agricultural area (UAA) and economic output.
We characterised the MOFs by selecting a smaller set of variables from the census data (Table 1) to identify groups based on farm characteristics and activities. We selected these variables by cross-referencing them with the scientific literature published since the early 2000s. They are associated with key characteristics of various entrepreneurial profiles in agriculture (van der Ploeg, 2009; Carelsen et al., 2021; Pappa et al., 2021; Schnebelin, 2022), or have been used in the literature to analyse the behaviours of farmers (Köbrich et al., 2002; van der Ploeg, 2009; Salvioni et al., 2013; Weltin et al., 2017; Bartkowski et al., 2022 López-Felices et al., 2023; Gómez-Limón et al., 2024) or to identify the determinants driving farm management choices (Vandermersch, Mathijs, 2002; Seuneke et al., 2013; Kuswardhani et al., 2014; Pindado, Sánchez, 2017; Bartkowski, Bartke, 2018; Daxini et al., 2019; Corsi et al., 2021; Graskemper et al., 2021a, 2021b).
| Thematic areas | Variables | Relevant references | |||||||||||||||||
|---|---|---|---|---|---|---|---|---|---|---|---|---|---|---|---|---|---|---|---|
| Market relations | Sales revenue (%) Self-consumption (%) |
Fabiani, Scarano, 1993; Salvioni et al., 2013; Carelsen et al., 2021; Schnebelin, 2022 | |||||||||||||||||
| Human capital | Age of the farm manager | Vandermersch, Mathijs, 2002; Kuswardhani et al., 2014; Pindado, Sánchez, 2017; Bartkowski, Bartke, 2018; Daxini et al., 2019; Bartkowski et al., 2022; Corsi et al., 2021; Graskemper et al., 2021a, 2021b; Pappa et al., 2021; Schnebelin, 2022; López-Felices et al., 2023; Gómez-Limón et al., 2024 | |||||||||||||||||
| Management experience | Köbrich et al., 2002; Vandermersch, Mathijs, 2002; Kuswardhani et al., 2014; Pindado, Sánchez, 2017; Bartkowski, Bartke, 2018; Pappa et al., 2021; López-Felices et al., 2023 | ||||||||||||||||||
| Education level | Vandermersch, Mathijs, 2002; Seuneke et al., 2013; Kuswardhani et al., 2014; Weltin et al., 2017; Pindado, Sánchez, 2017; Bartkowski, Bartke, 2018; Daxini et al., 2019; Bartkowski et al., 2022; Corsi et al., 2021; Graskemper et al., 2021a, 2021b; Pappa et al., 2021; Schnebelin, 2022; López-Felices et al., 2023 | ||||||||||||||||||
| Economic size and production orientation |
Standard output | van der Ploeg, 2009; Daxini et al., 2019; Schnebelin, 2022 | |||||||||||||||||
| Type of farming | Salvioni et al., 2013; Seuneke et al., 2013; Weltin et al., 2017; Daxini et al., 2019; Bartkowski, Bartke, 2018; Bartkowski et al., 2022; Corsi et al., 2021; Graskemper et al., 2021b; Schnebelin, 2022 | ||||||||||||||||||
| Organic certification | Salvioni et al., 2013; Weltin et al., 2017; Graskemper et al., 2021b; Schnebelin, 2022; López-Felices et al., 2023 | ||||||||||||||||||
| Work organisation | Extra-family work force | Weltin et al., 2017; Carelsen et al., 2021; Schnebelin, 2022; López-Felices et al., 2023 | |||||||||||||||||
| Outsourcing services | Vandermersch, Mathijs, 2002; Schnebelin, 2022; Gómez-Limón et al., 2024 | ||||||||||||||||||
| Off-farm work commitment of manager | Köbrich et al., 2002; Weltin et al., 2017; Daxini et al., 2019; Bartkowski et al., 2022; Graskemper et al., 2021a, 2021b; Gómez-Limón et al., 2024 | ||||||||||||||||||
| Strategic entrepreneurial orientation | Participation in associations | Vandermersch, Mathijs, 2002; Bartkowski, Bartke, 2018; Graskemper et al., 2021a; Graskemper et al., 2021b; Pappa et al., 2021; Schnebelin, 2022 | |||||||||||||||||
| Other gainful activities (diversification) |
Vandermersch, Mathijs, 2002; Salvioni et al., 2013; Seuneke et al., 2013; Weltin et al., 2017; Bartkowski, Bartke, 2018; Graskemper et al., 2021a, 2021b; Schnebelin, 2022 | ||||||||||||||||||
| Innovation investments | Bartkowski, Bartke, 2018 | ||||||||||||||||||
| Information technology tools | Vandermersch, Mathijs, 2002; Bartkowski, Bartke, 2018; Bartkowski et al., 2022; Carelsen et al., 2021; Schnebelin, 2022; López-Felices et al., 2023 | ||||||||||||||||||
| Leased land | Gomez-Limon et al., 2024 | ||||||||||||||||||
| Note: each variable was categorised following the classification shown in Table A.1. | |||||||||||||||||||
| Source: developed by the authors. | |||||||||||||||||||
We grouped the variables into five thematic areas which reflect key entrepreneurial operational contexts for the farm managers: market relations, human capital, economic size and production orientation, work organisation, and strategic entrepreneurial orientation. We used these thematic areas to provide information about the types of entrepreneurial behaviour and choices.
We chose the hierarchical cluster analysis method3 to classify farms because it has been widely used in the literature to group similar observations for some common characteristics. Due to the large number of MOF observations (>450,000), we first stratified them by three key variables considered in the literature as the most significant in discriminating the main entrepreneurial characteristics of farms: age4 (3 classes), economic size (3 classes) and type of farming (4 classes).
We applied the cluster method to the frequency distribution of farms across these three classes with those of the other selected variables. The resulting matrix dimensions are 36 rows by 31 columns, a portion of which is shown in Table A.2. Each row of the matrix identifies a unique age/size/type data combination (observation unit), used by the cluster method to measure the similarity. This approach aggregates groups formed by combinations of the three classes, rather than single farms. Regarding the main stratification, we can assume that demographic, economic and managerial affinities constrain possible management choices and therefore also entrepreneurial behaviours. The results of the cluster analysis highlighted nine groups, each of which represents an entrepreneurial profile. We characterised these profiles using specific indicators such as propensity for innovation, work commitment, and environmental sustainability.
Before presenting the results, we show the stratification of farms in Table 2. After a short description of their main characteristics, we associate these features with distinct entrepreneurial profiles resulting from the cluster analysis.
| Age (years) |
Type of farming | Standard output (thousands of euros) |
Total | ||||||||||||||||
|---|---|---|---|---|---|---|---|---|---|---|---|---|---|---|---|---|---|---|---|
| 8-25 | 25-100 | ≥100 | |||||||||||||||||
| Number of farms (units) | |||||||||||||||||||
| ≤40 | Field crops | 6,285 | 8,310 | 4,785 | 19,380 | ||||||||||||||
| Permanent crops | 7,397 | 11,253 | 4,790 | 23,440 | |||||||||||||||
| Livestock | 2,541 | 6,895 | 6,627 | 16,063 | |||||||||||||||
| Mixed | 3,395 | 4,523 | 1,822 | 9,740 | |||||||||||||||
| Total | 19,618 | 30,981 | 18,024 | 68,623 | |||||||||||||||
| 41-67 | Field crops | 33,089 | 30,310 | 18,071 | 81,470 | ||||||||||||||
| Permanent crops | 39,017 | 41,042 | 17,648 | 97,707 | |||||||||||||||
| Livestock | 9,195 | 20,230 | 22,140 | 51,565 | |||||||||||||||
| Mixed | 12,783 | 12,925 | 5,976 | 31,684 | |||||||||||||||
| Total | 94,084 | 104,507 | 63,835 | 262,426 | |||||||||||||||
| >67 | Field crops | 25,512 | 13,780 | 5,063 | 44,355 | ||||||||||||||
| Permanent crops | 29,119 | 20,109 | 5,353 | 54,581 | |||||||||||||||
| Livestock | 4,051 | 5,350 | 4,659 | 14,060 | |||||||||||||||
| Mixed | 7,887 | 4,976 | 1,560 | 14,423 | |||||||||||||||
| Total | 66,569 | 44,215 | 16,635 | 127,419 | |||||||||||||||
| Grand total | 180,271 | 179,703 | 98,494 | 458,468 | |||||||||||||||
| Share of grand total (%) | |||||||||||||||||||
| ≤40 | Field crops | 1.4 | 1.8 | 1.0 | 4.2 | ||||||||||||||
| Permanent crops | 1.6 | 2.5 | 1.0 | 5.1 | |||||||||||||||
| Livestock | 0.6 | 1.5 | 1.4 | 3.5 | |||||||||||||||
| Mixed | 0.7 | 1.0 | 0.4 | 2.1 | |||||||||||||||
| Total | 4.3 | 6.8 | 3.9 | 15.0 | |||||||||||||||
| 41-67 | Field crops | 7.2 | 6.6 | 3.9 | 17.8 | ||||||||||||||
| Permanent crops | 8.5 | 9.0 | 3.8 | 21.3 | |||||||||||||||
| Livestock | 2.0 | 4.4 | 4.8 | 11.2 | |||||||||||||||
| Mixed | 2.8 | 2.8 | 1.3 | 6.9 | |||||||||||||||
| Total | 20.5 | 22.8 | 13.9 | 57.2 | |||||||||||||||
| >67 | Field crops | 5.6 | 3.0 | 1.1 | 9.7 | ||||||||||||||
| Permanent crops | 6.4 | 4.4 | 1.2 | 11.9 | |||||||||||||||
| Livestock | 0.9 | 1.2 | 1.0 | 3.1 | |||||||||||||||
| Mixed | 1.7 | 1.1 | 0.3 | 3.1 | |||||||||||||||
| Total | 14.5 | 9.6 | 3.6 | 27.8 | |||||||||||||||
| Grand total | 39.3 | 39.2 | 21.5 | 100.0 | |||||||||||||||
| Source: elaborations based on the ISTAT Agricultural Census, 2020. | |||||||||||||||||||
Young farmers (≤40 years old) represent 15% of MOFs, a higher share than the total population (9%). Intermediate farmers (between 41 and 67 years old) are the largest group (57%), while 28% of farmers of over 67 years of age are still active, despite being well above retirement age.
MOFs are concentrated in the two lower economic size classes, which together represent nearly 80% of the total. There are significant differences in SO across the age groups. Among young farmers, the intermediate SO class (25,000-100,000 euros) is the most common (45%), with an equal distribution for the other two SO classes. For the older farmers, the lowest SO class is most common. Finally, the middle-aged farmers have a more balanced distribution regarding the SO classes. The most common agricultural type among the MOFs is permanent crops, which includes almost 40% of the production units. The mixed type is the least common (12%), indicating that 88% of MOFs are involved in specialised production. Regarding the age groups, livestock orientation is particularly notable for the young farmers, whereas permanents crops are particularly relevant for older farmers (43%).
3.2. Presentation and discussion of the entrepreneurial profiles
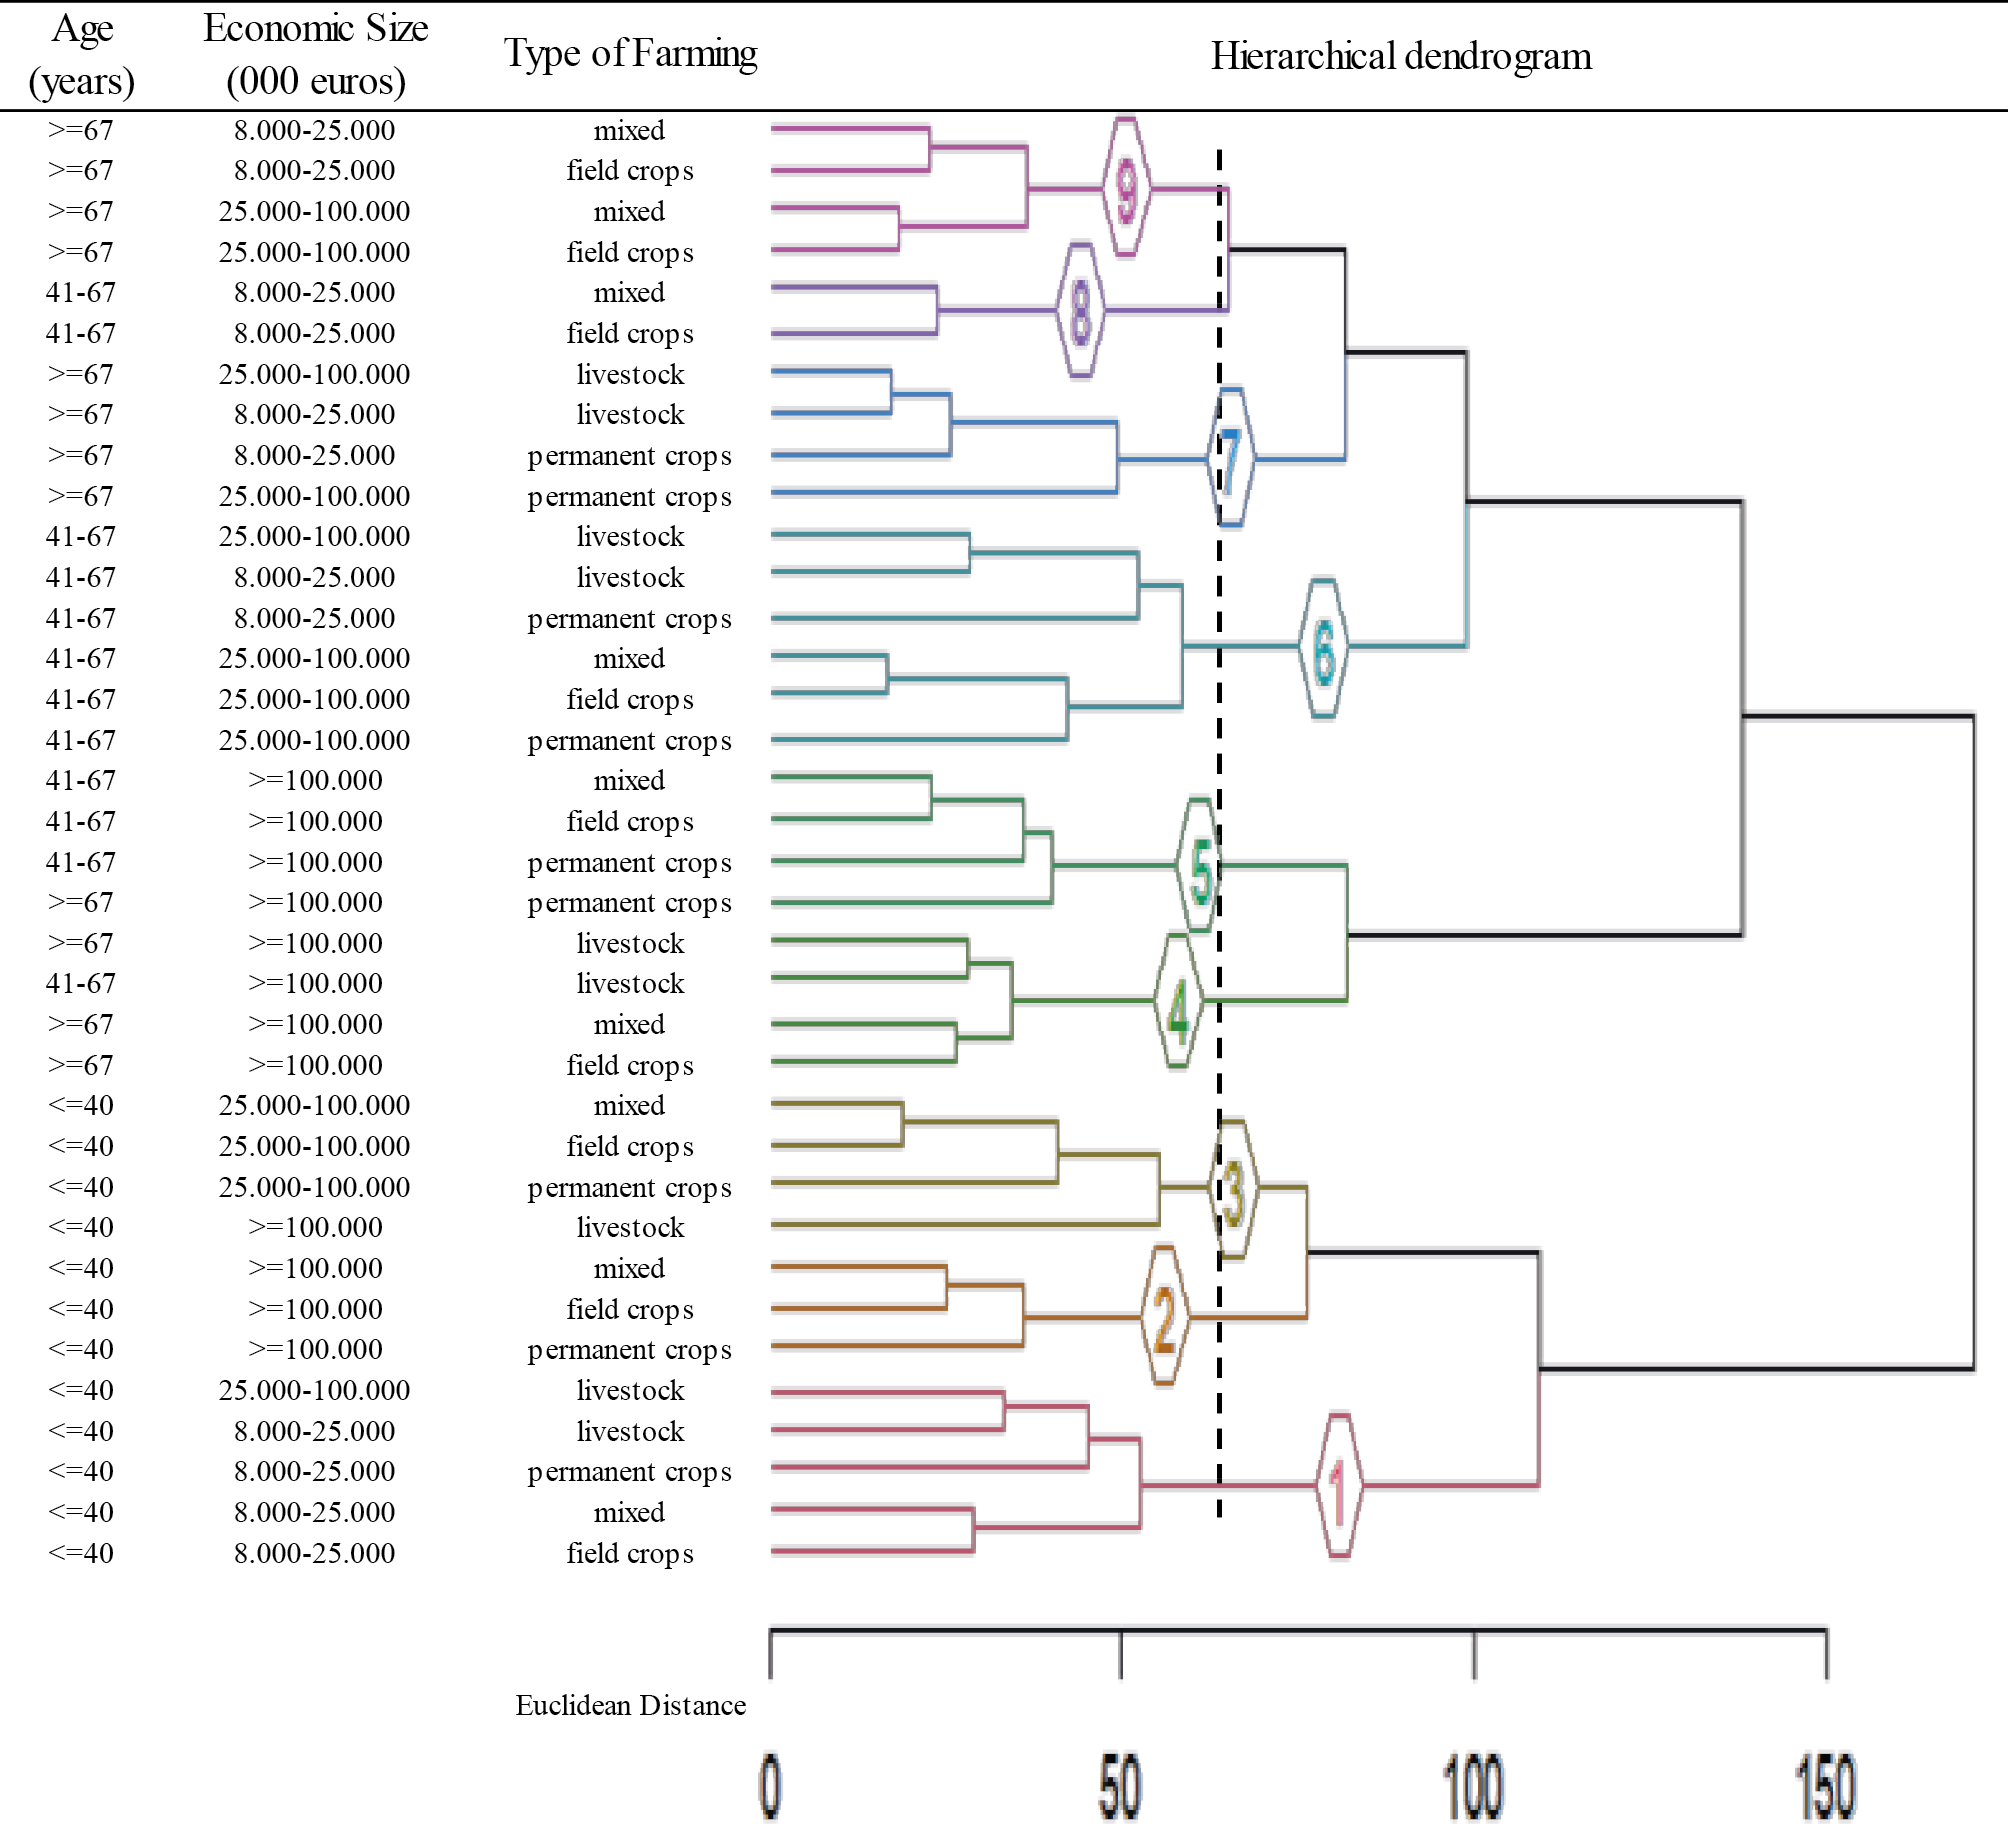
The dendrogram in Figure 2 graphically represents the aggregation process of the groups from left to right. The black dotted line marks the cut-off position where the nine groups5 are formed by the clustering process.
We developed specific entrepreneurial profiles based on these clusters by assigning each farm to a specific group. Table A.3 indicates the characteristics which determined the homogeneity and dissimilarity of the clusters. The maximum and minimum values by row (cells with bold and italic text, respectively) indicate the most defining variables for each profile. Table 3 lists the identified profiles, their share on total MOFs and the probability values6 that estimate the clusters robustness.
| Profile | Characterisation | % share of total | AU p-value (%) |
||||||||||||||||
|---|---|---|---|---|---|---|---|---|---|---|---|---|---|---|---|---|---|---|---|
| 1 | Young farmers looking for a stable professional status | 5.8 | 94 | ||||||||||||||||
| 2 | Innovative and diversified young entrepreneurs | 2.5 | 91 | ||||||||||||||||
| 3 | Young farmers in the entrepreneurial development phase | 6.7 | 93 | ||||||||||||||||
| 4 | Experienced entrepreneurs of structured livestock farms | 7.3 | 89 | ||||||||||||||||
| 5 | Experienced entrepreneurs of diversified structured farms | 10.3 | 93 | ||||||||||||||||
| 6 | Senior farmers of traditional farms | 33.3 | 96 | ||||||||||||||||
| 7 | Older entrepreneurs of de-structured small to medium-sized farms | 12.8 | 84 | ||||||||||||||||
| 8 | Part-time farmers of less specialised small farms | 10.0 | 98 | ||||||||||||||||
| 9 | Older entrepreneurs of declining small to medium-sized farms | 11.4 | 100 | ||||||||||||||||
| Source: elaborations based on the ISTAT Agricultural Census, 2020. | |||||||||||||||||||
Clusters 1-3, which include young farmers, are clearly distinct from clusters 4-9. The first group (5.8% of MOFs) includes young farmers with the highest incidence of the following answers: “no” for outsourcing services, “less than three years” regarding management experience, and “diploma and degree from other schools” for the education level. They have the lowest off-farm commitment and participation in associations. These characteristics suggest a profile of young farmers with a fair level of education who mainly work on the farm, but its economic size is insufficient to fully support them. We define them as “young farmers looking for a stable professional status”.
The second group (2.5% of MOFs) refers to managers under 40 years of age who have established themselves as agricultural entrepreneurs, manage structured farms (based on the SO), and have specific agricultural education. They are involved in diverse, innovative activities, including organic production and the use of information technology (IT) tools for business management, and participate in producer associations. They do not engage in livestock activities. They are therefore “innovative and diversified young entrepreneurs” who take advantage of the opportunities offered by new technologies and market trends, opting to farm land without the need to purchase it.
The third group of young farmers (6.7% of MOFs) is intermediate between the two previous profiles. They have managed medium-sized businesses for over three years and are predominantly engaged in agricultural activities. They can be labelled “young farmers in the entrepreneurial development phase” and are less professionalised than the second group because they manage farms with a smaller economic size. Nevertheless, this group is larger than the second group and represents a particularly good target of dedicated support policies.
Regarding the other six groups, in the upper part of the dendrogram, the demographic and productive characteristics seem less distinct: in the seventh and ninth groups, older farm managers prevail, while in the fourth and fifth groups the economic size is larger. The details in Table A.3 show that there are significant differences between these groups.
The fourth group includes 7.3% of MOFs and shows the highest level of livestock activities and participation in associations, along with innovative investments. The fifth group (10.3% of MOFs) has similar characteristics as the fourth group but is a little more pronounced, excluding livestock activities. They are two similar entrepreneurial profiles that run structured companies differently in terms of production orientation: the former is more specialised, and the latter is more diversified. Based on these different characteristics, the fourth group is assigned the profile “experienced entrepreneurs of structured livestock farms” and the fifth group is “experienced entrepreneurs of diversified structured farms”.
The sixth group is the largest one, with approximately 33% of MOFs; consequently, it is less characterised by class distributions (i.e., it is intermediate). It represents the less-defined profile “senior farmers of traditional farms”, due to their low propensity for innovation and their limited diversification.
The seventh group (12.8% of MOFs) includes only older farmers with the lowest level of education but more experience. The profile labelled “older entrepreneurs of de-structured small to medium-sized farms” shows very low levels of diversification, innovation, participation in associations, the use of organic methods, and rented land. These characteristics are indicative of farmers with a weak entrepreneurial profile mainly engaged in the cultivation of permanent crops.
The eighth group (10.0% of MOFs) includes 41–67-year-old farmers who run farms with a smaller economic size with similar characteristics to the seventh group. However, these farmers are younger, have a higher education level, and have more extra-farm commitments compared with the seventh group. This group shows low professionalisation and the highest percentage of off-farm work. The profile is denoted as “part-time farmers of small farms”.
The ninth group (11.4% of MOFs) is composed exclusively of older farmers with a low business commitment who predominantly rely on outsourcing services and show little propensity for innovation and quality production. The profile labelled “older entrepreneurs of declining small to medium-sized farms” includes farmers who appear to have the least professionally active entrepreneurial profile among all those analysed. This group differs from the seventh group based on a greater productive orientation towards short-term agricultural activities (e.g., arable crops).
We next compared our entrepreneurial profiles with typologies that have been reported in the literature for other parts of Europe7. Graskemper et al. (2021b) identified three farmer typologies in Germany using the PAM cluster method on online survey data. First, “conventional growers” include older farmers primarily involved in arable crops. This aligns with profile 6 (“senior farmers of traditional farms”) and, to some extent, profile 5 (“experienced entrepreneurs of diversified structured farms”, the most professional segment). Second, “versatile youngsters” include younger farmers, similar to profiles 1-3. However, this group appears to more diverse and less numerous in Italian agriculture. Finally, “family-based farmers” can be associated with profiles 7-9 (older farmers) and partially with profile 5 (“experienced entrepreneurs of diversified structured farms”). Household farms are prevalent in Italy, meaning this characteristic is present across all Italian profiles.
McElwee (2008) identified four farmer types based on interviews in the United Kingdom. First, “farmer as farmer” describes mature farmers with good technical skills but limited innovation or diversification. This profile matches profile 6 (“senior farmers of traditional farms”), which includes farmers who form the core of Italian agriculture. In addition, profiles 7-9 (older farmers of small to medium-sized farms) could also fit here, representing the least dynamic and often declining segment. Second, “farmer as entrepreneur” includes farmer-entrepreneurs who capitalise on market opportunities, even outside agriculture. This aligns with profiles 2 (“innovative and diversified young entrepreneurs”) and 3 (“young farmers in the entrepreneurial development phase”). Third, “farmer as contractor” refers to expert entrepreneurs with market knowledge and adequate resources. This typology can be linked to profile 4 (“experienced entrepreneurs of structured livestock farms”) and 5 (“experienced entrepreneurs of diversified structured farms”), although the term “contractor” implies a strong supply chain integration that is not always present in Italy. Finally, “rural entrepreneur” represents highly specialised non-agricultural entrepreneurs with strong managerial skills. We did not find an equivalent profile based on our analysis, possibly because in Italy these roles often take legal and organisational forms outside the agricultural sector. Of note, profile 1 (“young farmers looking for a stable professional status”) does not fit into the types described by McElwee (2008). This might be because, unlike the United Kingdom, the Italian job market, especially in rural areas, offers limited employment opportunities for young people.
Weltin et al. (2017) identified six farm typologies from various European regional case studies using factor and cluster analyses. First, “diversified small farm households” include mainly older, full-time, and quite diversified farmers. As diversification implies other income sources, this group matches profiles 7 (“older entrepreneurs of de-structured small to medium-sized farms”) and 9 (“older entrepreneurs of declining small to medium-sized farms”); for these profiles, pensions provide significant supplementary income. Second, “young organic farm households” are similar to profile 2 (“innovative and diversified young entrepreneurs”), due to the use of organic farming methods and extra-family labour. Third, “LFA-adapted mixed farms” considers geographical location8, which we have not used to identify profiles of Italian farmers. Nevertheless, profile 3 (“young farmers in the entrepreneurial development phase”) is similar in terms of economic size and education level. Fourth, “traditional part-time crop farms” shares characteristics with profile 8 (“part-time farmers of less specialised small units”) due to low diversification and a lower rate of innovation. Fifth, “small-scale livestock specialists” have similar traits to profile 1 (“young farmers looking for a stable professional status”): they likely continue family livestock activities but with low economic sustainability. Finally, “intensive livestock professionals” is an excellent match to profile 4 (“experienced entrepreneurs of structured livestock farms”) due to their large economic size and specialisation. Note that profiles 5 (“experienced entrepreneurs of diversified structured farms”) and 6 (“senior farmers of traditional farms”) do not align with the types described by Weltin et al. (2017). This is likely because they are quite transversal, especially the latter, which represents the largest share of the Italian farms studied.
Despite the limitations due to differing study objectives, this comparison reveals that some farmer profiles are recurrent across European agricultural systems. The main difference in the Italian context is a greater heterogeneity of profiles due to, among other issues, the great variety of farms registered by the 7th ISTAT Agricultural Census and by greater differentiation of age and other features of farmers. Consequently, border situations coexist with a central core of numerous traditional agricultural farms characterised by low diversification and innovation.
3.3. Comparative analysis of the entrepreneurial profiles
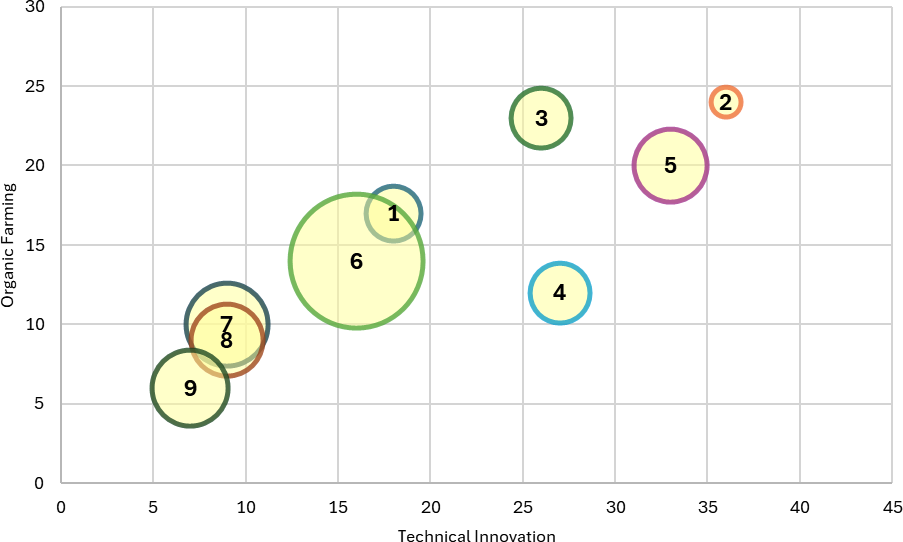
To summarise the differences in the level of entrepreneurship among the nine profiles, we plotted them on graphs according to the economic, social and environmental dimensions of the entrepreneurial attitude. In Figure 3, we measure the economic dimension defined by the propensity to diversify and to innovate in the groups. Figure 4 represents off-farm work and the outsourcing propensity of MOFs. Finally, Figure 5 features technical innovation and organic farming. The size of the bubble in each figure represents the percentage share of the group in the total MOFs.
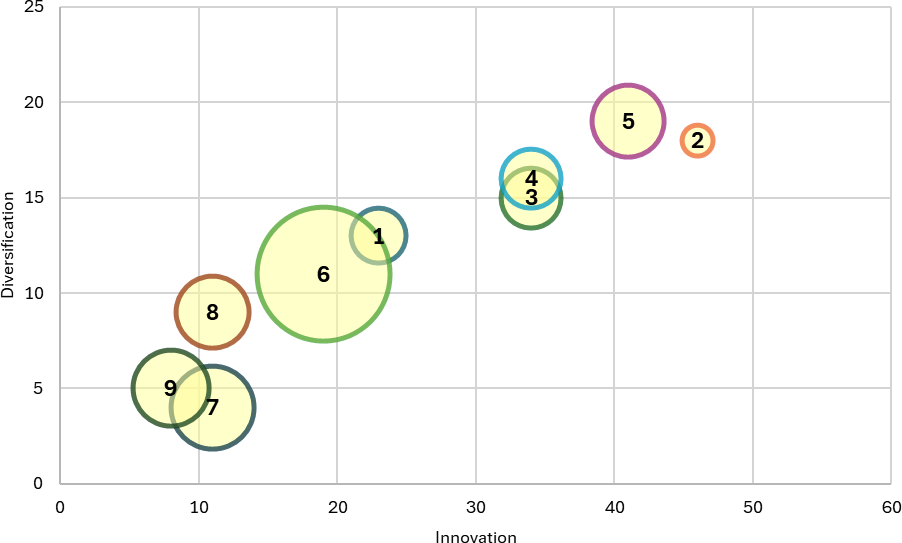
For the economic dimension (Figure 3), the key skills investigated are the ability to broaden the scope and range of business activities (diversification) and the propensity to innovate (Dias et al., 2022). The position of each bubble from the origin to the upper right quadrant indicates an increasing level of entrepreneurial skills, which is lowest in profiles 9 (“older entrepreneurs of declining small to medium-sized farms”) and 7 (“older entrepreneurs of de-structured small to medium-sized farms”) and highest in profiles 2 (“innovative and diversified young entrepreneurs”) and 5 (“experienced entrepreneurs of diversified structured farms”). The entrepreneurial profiles most inclined towards innovation and diversification mainly comprise young and experienced farms who collectively represent approximately a quarter of all professional MOFs. The profiles that are less inclined towards innovation and diversification include both older farms and young entrepreneurs looking for stable employment. Profile 6 (“senior farmers of traditional farms”) demonstrates a low to medium level of innovation and diversification.
Figure 4 presents the social implications of farm management choices, based on the off-farm commitment of farmers and the use of outsourcing work (Xu et al., 2022). There is a notable diagonal line that includes seven of the profiles. Specifically, profile 9 (“older entrepreneurs of declining small to medium-sized farms”) appears at the far left; these farmers use more outsourcing services despite being mainly employed on the farm. Profile 1 (“young farmers looking for a stable professional status”) appears at the far right; these farmers are less committed in the farm but also make minimal use of external services. Profiles 7 (“older entrepreneurs of de-structured small to medium-sized farms”) and 8 (“part-time farmers of less specialised small units”) fall outside this diagonal line. Profile 7 includes farmers who are more committed to on-farm activities than to adopting external services. Conversely, profile 8 includes farmers who use outsourcing services to compensate for lower on-farm workforce commitment.
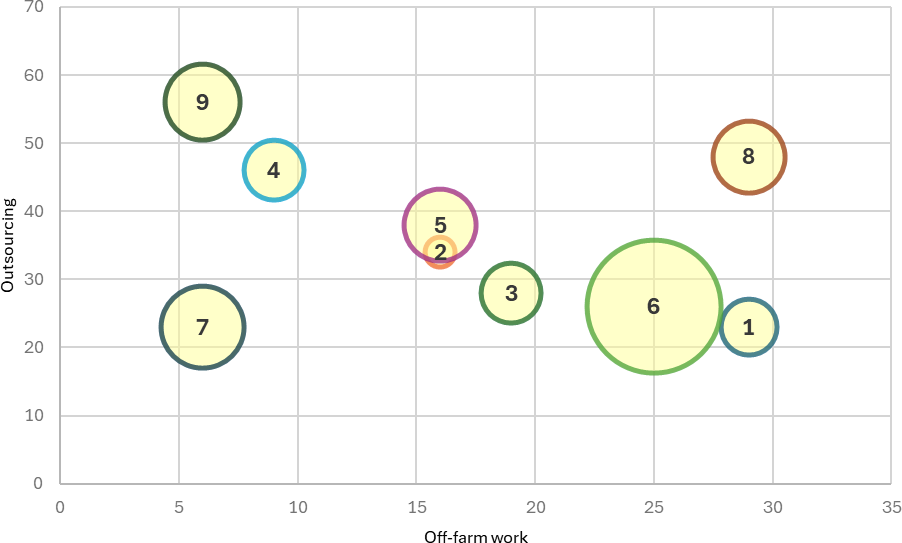
Figure 5 presents an examination of the adoption of technical innovations and organic production methods, building on the assumption that they serve as proxies of environmental sustainability (Kroma, 2008). The connection is clear as the profiles tend to align along the bisector of the Cartesian plane: the incidence of technological investments and the percentage of organic farms increase at the same pace. Organic farming cannot be considered an exhaustive indicator of the environmental sustainability of agricultural activities, but its positive correlation with investments in technical innovations suggests that the objective of environmental sustainability is well received by the most innovative entrepreneurs, particularly young farmers of profile 2 (“innovative and diversified young entrepreneurs”) and older farmers of profile 5 (“experienced entrepreneurs of diversified structured farms”).
Our comparative analyses revealed three grouping of the entrepreneurial profiles:
– The high entrepreneurial group (profiles 2-5) includes young, innovative, and professionally developing farmers, along with experienced entrepreneurs of structured farms. They show a high propensity for innovation, diversification, and sustainability (Figures 3 and 5). However, their work-related characteristics are less clearly defined (Figure 4). Overall, this group appears to have the highest level of entrepreneurship among professional MOFs.
– The intermediate entrepreneurial group (profiles 1 and 6) includes both young farmers looking for a stable professional status and senior farmers of common and not very innovative units, indicating that not all young entrepreneurs are innovators. In fact, young farmers included in profile 1 seem to align with the most widespread agricultural business model among our sample, characterised by moderate innovation and diversification.
– The low entrepreneurial group (profiles 7-9) comprises older or part-time farmers who exhibit the fewest entrepreneurial characteristics among the MOFs. They have a low propensity for innovation and diversification.
4. Conclusions and future research
The theoretical background and our review of the literature provided a solid framework for us to identify drivers of entrepreneurship in Italian agriculture. Some of these drivers are sector related, others are linked to traditional and innovative activities, and still others are related to territorial disparities stimulated by policies. Our results confirm the coexistence of different well-defined groups of farms in the Italian agricultural sector. They go beyond the classic dichotomies that have dominated traditional analyses because they do not just distinguish between active and inactive; rather, they consider market activities and the prevalent economic objectives. Our analysis confirms that the coexistence of rather overlapping models is a specific feature of Italian agriculture, despite the important changes that have occurred in the last decades, mainly due to the large outflow of farms (Henke, Sardone, 2022).
We focused on MOFs (SO >8,000 euros) assuming they represent the core of Italian farms integrated into the food supply chain. This does not mean that all the other farms are irrelevant to the primary sector and rural areas or to the economy and society as a whole. On the contrary, our findings show that better knowledge of the processes that occur in the primary sector can lead to a more targeted acknowledgement of the actual role these units have on rural territories and in the general process of sustainable development.
Our results help to highlight some relevant policy implications, especially at the time of a rather crucial policy reform and in light of the European Union (EU)’s efforts to tailor public support and the more general goal of a better match between demand and supply of public policies in agriculture and rural areas. Despite the effort of the Common Agricultural Policy (CAP) to improve the targeting and selectivity of public intervention, there is an evident mismatch in the ability of policies to meet the needs of farmers. The effort of the EU to switch from a “one-size-fits-all” model of intervention to a more targeted and tailored approach with selective tools is still underway and has left many actors of the agri-food system unsatisfied with the results (Henke et al., 2018, 2024; Sotte, Brunori, 2025). The recent riots in Italy and other parts of Europe confirm that, beyond the political games and the roles played by the political forces in driving and conditioning the protest, deeper knowledge of the multifaceted activities of farmers, their sources of income, and their innovation capacity are key to design and implement effectives policies able to target beneficiaries (Mazzocchi et al., 2024). For these reasons, the evolution of research and analysis on these matters and an appropriate and updated set of indicators become particularly relevant.
This issue has also been reignited by the recent document about the vision for the future agriculture and food (European Commission, 2025). First, the European Commission counts on generational renewal for a new season of investment, innovation and diversification in agriculture (Licciardo et al., 2024). Given our results, this syllogism should not be taken for granted, at least in Italy, where apparently only some young farmers adopt new business models, while others prefer to continue traditional and low-risk agricultural activities (Carbone et al., 2024). Second, the European Commission potentially addresses the CAP financial resources to “farmers that actively engage in food production, towards the economic vitality of farms and the preservation of our environment” (European Commission, 2025, p.8). This is a rather ambiguous definition that opens up a new debate about who are the active farms engaged in agriculture and food production, and the role of those we have identified as MOFs. All this calls for more research and a deeper investigation on farmers and their businesses. Our work is just a preliminary analysis to examine the situation in Italy based on the data collected as part of the 7th ISTAT Agricultural Census.
We tried to provide a definition of active farms and market-oriented farmers, but following this approach the potential beneficiaries of the public support in Italian agriculture and rural areas might be significantly reduced if public policies intend to reach only “real farmers”. Consequently, it could also significantly reduce the agricultural area eligible for EU policy support, with dramatic consequences for the proper conditions of land stewardship. Finally, if we add the scarce effectiveness of the support devoted to young farmers, especially in recent years, we must conclude that the way public support is designed and implemented should be reconsidered in an effort to identify new, more coherent, and more effective ways to bring resources into agriculture and rural areas. This endeavour should involve a more in-depth analysis of the entrepreneurial attitude of young people who enter the agricultural sector. Future policies could combine incentive policies with training and education programmes, and redesign accompanying social policies for farmer retirements and planning new forms of access to land (Borda et al., 2023; Carbone et al., 2024).
Future work requires more in-depth analysis of the data collected from the 7th ISTAT Agricultural Census. The information and data to which we have access – much more robust even compared with the recent past – has allowed us to identify nine entrepreneurial profiles in the Italian agricultural sector. Nevertheless, these results could be further validated and extended by considering emerging key topics such as carbon transition by using other available datasets (e.g., carbon registers, the new FSDN, and updated data about CAP implementation). This approach would improve collaboration among research, academic, and public institutions.
Another relevant issue that we have partially investigated is the wide theme of labour, including the contribution of the farm holders’ families. Further investigation about the number of days worked by the holders and their families and the combination of on- and off-farm work is crucial to deeply understand the dynamics in agriculture, as well as the growth of contracted work and services (Hervieu, Purseigle, 2022; Sotte, Brunori; 2025). It would be quite interesting to analyse the links between our entrepreneurial profiles and the trajectories and typologies of labour employed both on- and off-farm.
Another future step from our study is to undertake a comparative analysis on how agricultural entrepreneurial profiles are characterised in the other EU Member States. This could involve a comparison between Northern and Southern EU Member States and more recent EU Member States from Eastern Europe. In any case, the development of studies highlighting the specificities for each Member State, such as the work we have presented here, should also be welcomed considering possible future developments of the CAP under the next Multiannual Financial Framework (2028-2034), where the more limited resources available to support farmers will require Member States to take more targeted and selective national decisions. Once again, we believe that it is crucial to design targeted policies for agricultural start-up activities and young farmers, because generational change in agriculture occurs at a different pace, under different conditions, and with different consequences in each country. We have preliminarily explored this aspect in this paper, and it deserves further specific investigation.
This research received no external funding.
The authors would like to thank Edward Kyei Twum for helpful reading of the first draft of this paper.
Conceptualization, A.A., C.C., R.H. and R.S.; Methodology, A.A.; Software, A.A. and C.C.; Data curation, C.C.; Writing, A.A., C.C., R.H. and R.S.; Bibliographic research, A.A., R.H. and R.S.; Supervision, R.H. and R.S.
Arzeni A., Sotte F. (2014). Agricoltura e territorio: dove sono le imprese agricole? La Questione Agraria, 1: 73-100. DOI: https://doi.org/10.3280/QU2014-001003.
Barbero G. (1982). Quante sono le aziende agricole italiane? REA - Rivista di Economia Agraria, 2: 329-366.
Bartkowski B., Bartke S. (2018). Leverage points for governing agricultural soils: a review of empirical studies of European farmers’ decision-making. Sustainability, 10, 3179. DOI: https://doi.org/10.3390/su10093179.
Bartkowski B., Schüßler C., Müller B. (2022). Typologies of European farmers: approaches, methods and research gaps. Regional Environmental Change, 43. DOI: https://doi.org/10.1007/s10113-022-01899-y.
Borda A.J., Sárvári B., Máté Balogh J. (2023). Generation Change in agriculture: a systematic review of the literature. Economies, 11(5), 129. DOI: https://doi.org/10.3390/economies11050129.
Boyko N.I., Tkachyk O.A. (2023), Hierarchical clustering algorithm for dendrogram construction and cluster counting. Informatics and Mathematical Methods in Simulation, 13(1-2): 5-15. DOI: https://doi.org/10.15276/imms.v13.no1-2.5.
Carbone A., Carillo F., Ciaian P., Sardone R., Antonioli F., Cardona J.T. (2024). Does the European Union start-up aid help young farmers to innovate and to join networks? Agriculture, 14, 1772. DOI: https://doi.org/10.3390/agriculture14101772.
Cardwell M. (2004). The European Model of Agriculture. Oxford University Press, Oxford, UK.
Carelsen C.P.R., Ncube B., Fanadzo M. (2021). Classification and characterisation of smallholder farmers in South Africa: a brief review. South African Journal of Agricultural Extension, 49(2): 97-106. DOI: https://doi.org/10.17159/2413-3221/2021/v49n2a12821.
Condor R. (2020). Entrepreneurship in agriculture: a literary review. International Journal of Entrepreneurship and Small Business, 40(4): 516-552. DOI: https://doi.org/10.1504/IJESB.2020.109013.
Corsi A., Frontuto V., Novelli S. (2021). What drives farm structural change? An analysis of economic, demographic and succession factors. Agriculture, 11: 438. DOI: https://doi.org/10.3390/agriculture11050438.
Daxini A., Ryan M., O’Donoghue C., Barnes A.P., Buckley C. (2019). Using a typology to understand farmers’ intentions towards following a nutrient management plan. Resources, Conservation and Recycling, 146: 280-290. DOI: https://doi.org/10.1016/j.resconrec.2019.03.027.
Devitiis B., Maietta O.W. (2013). Regional patterns of structural change in Italian agriculture. In Oertiz-Miranda D., Moragues-Faus A., Arnalte-Alegre E. (eds) Agriculture in Mediterranean Europe. Between Old and New Paradigms (pp. 173-215). Emerald, Bingley, UK.
Dias C.S.L., Rodrigues R.G., Ferreira J.J. (2019). What’s new in the research on agricultural entrepreneurship. Journal of Rural Studies, 65: 99-115. DOI: https://doi.org/10.1016/j.jrurstud.2018.11.003.
Dias C.S.L., Rodrigues R.G., Ferreira J.J. (2022). Farm diversification efforts, (open) innovation networks and performance: what is the connection? British Food Journal, 124(6): 1912-1938. DOI: https://doi.org/10.1108/BFJ-02-2021-0201.
European Commission (2025). Communication from the Commission to the European Parliament, the Council, the European economic and social committee and the committee of the Regions. A Vision for Agriculture and Food Shaping together an attractive farming and agri-food sector for future generations, COM(2025) 75 final, Brussels.
Fabiani G., Scarano G. (1995). Una stratificazione socioeconomica delle aziende agricole: pluralismo funzionale e sviluppo territoriale. La Questione Agraria, 59: 27-92.
Fanfani R. (2008). Il processo di ammodernamento delle aziende agricole italiane (1990-2005). Agriregionieuropa, 12: 39-42.
Gismondi R. (2024). A census-based sustainability indicator of agricultural holdings: the case of Italy. Italian Review of Agricultural Economics, 79(2): 35-48. DOI: https://doi.org/10.36253/rea-15056.
Gómez-Limón J.A., Martín-García J., Granado-Díaz R. (2024). Building a typology of farms based on their performance: a tool to support agricultural policy-making. Journal of Environmental Planning and Management. DOI: https://doi.org/10.1080/09640568.2024.2391060.
Graskemper V., Yu X., Feil J.H. (2021a). Analyzing strategic entrepreneurial choices in agriculture—empirical evidence from Germany. Agribusiness, 37(3): 569-589. DOI: https://doi.org/10.1002/agr.21691.
Graskemper V., Yu X., Feil J.H. (2021b). Farmer typology and implications for policy design – an unsupervised machine learning approach. Land Use Policy, 103: 105328. DOI: https://doi.org/10.1016/j.landusepol.2021.105328.
Henke R., Benos T., De Filippis F., Giua M., Pierangeli F., Pupo D’Andrea M.R. (2018). The new Common Agricultural Policy: how do Member States respond to flexibility. Journal of Common Market Studies, 56(2): 403-419. DOI: https://doi.org/10.1111/jcms.12607.
Henke R., Pomponi T., Vassallo M., Mazzocchi G. Monteleone A., Sorrentino S. (2024). The new CAP and the participative method in decision-making: a textual analysis of the Italian case. Journal of Common Market Studies. DOI: https://doi.org/10.1111/jcms.13703.
Henke R., Povellato A., Vanni F. (2014). Elementi di multifunzionalità nell’agricoltura italiana: una lettura dei dati del censimento. QA - Rivista dell’Associazione Rossi-Doria, 1: 101-133. DOI: https://doi.org/10.3280/QU2014-001004.
Henke R., Sardone R. (2022). The 7th Italian Agricultural Census: new directions and legacies of the past. Italian Review of Agricultural Economics, 77(3): 67-75. DOI: https://doi.org/10.36253/rea-13972.
Herman E. (2025). Changes and challenges in EU agricultural holdings and their impact on rural development, Land, 14(5), 1080; DOI: https://doi.org/10.3390/land14051080.
Hervieu B., Puseigle F. (2022). Une agriculture sans agriculteurs. Classic Garnier, Paris. DOI: https://doi.org/10.48611/isbn.978-2-406-17650-3.p.0319.
Köbrich C., Rehman T., Khan M. (2003). Typification of farming systems for constructing representative farm models: two illustrations of the application of multi-variate analyses in Chile and Pakistan, Agricultural Systems, 76(1): 141-157. DOI: https://doi.org/10.1016/S0308-521X(02)00013-6.
Korkeaoja J. (2006). Our common model of agriculture. Eurochoices, 5(3): 6-12. DOI: https://doi.org/10.1111/j.1746-692X.2006.00037.x.
Kroma M.M., (2006). Organic farmer networks: facilitating learning and innovation for sustainable agriculture. Journal of Sustainable Agriculture, 28(4): 5-28. DOI: https://doi.org/10.1300/J064v28n04_03.
Kuswardhani N., Peeyush S., Shivakoti G.P. (2014). Cluster analysis for classification of farm households based on socio-economic characteristics for technology adoption in agriculture: a case study of West Java province, Indonesia. Journal of Food, Agriculture & Environment, 12: 238-247.
Lans T., Seuneke P., Klerkx L. (2013). Agricultural entrepreneurship. In Encyclopedia of Creativity, Invention, Innovation and Entrepreneurship. Springer Reference, New York, NY. DOI: https://doi.org/10.1007/978-1-4614-3858-8_496.
Licciardo F., Henke R., Piras F., Zanetti B. (2024). The setting-up measure to support generational renewal in agriculture: the Italian experience. World, 5: 1130-1147. DOI: https://doi.org/10.3390/world5040057.
Licciardo F., Tarangioli S., Gargano G., Tomassini S., Zanetti B. (2023). The 7th Census of Italian agriculture: characteristics, structures and dynamics of generational renewal. Italian Review of Agricultural Economics, 78(2): 109-118. DOI: https://doi.org/10.36253/rea-14578.
López-Felices B., Aznar-Sánchez J.A., Velasco-Muñoz J.F., Mesa-Vázquez E. (2023). Farmers’ profiles and attitudes towards the implementation of rainwater harvesting systems in intensive agriculture. International Journal of Agricultural Sustainability, 21(1): 2189402. DOI: https://doi.org/10.1080/14735903.2023.2189402.
Mantino F., Vanni F. (2018). The role of localized agri-food systems in the provision of environmental and social benefits in peripheral areas: evidence from two case studies in Italy. Agriculture, 8(8): 120. DOI: https://doi.org/10.3390/agriculture8080120.
Mazzocchi G., Vassallo M., Gabrieli G., Henke R. (2024). ‘No farmers, no food’: a sentiment analysis of the 2024 farmers’ protests in Italy. Italian Review of Agricultural Economics, 79(2): 93-106. DOI: https://doi.org/10.36253/rea-15468.
McElwee G. (2008). A taxonomy of entrepreneurial farmers. International Journal of Entrepeneurship and Small Business, 6(3): 465-478. DOI: https://doi.org/10.1504/IJESB.2008.019139.
McElwee G., Smith, R. (2012). Classifying the strategic capability of farmers: a segmentation framework. International Journal of Entrepreneurial Venturing, 4(2): 111-131. DOI: https://doi.org/10.1504/IJEV.2012.046517.
Milone P. (2024). The role of farmers: governing the farm enterprise, markets, and networks. Italian Review of Agricultural Economics, 79(3): 31-42. DOI: https://doi.org/10.36253/rea-15354.
Pappa E.C., Kondyli E., Sotirakoglou K., Bosnea L., Mataragas M., Allouche L., Tsiplakou E., Pappas A.C. (2021). Farmers profile and characterization of sheep and goat dairy chain in northwestern Greece. Sustainability, 13: 833. DOI: https://doi.org/10.3390/su13020833.
Passaro A., Randelli F. (2022). Spaces of sustainable transformation at territorial level: an analysis of biodistricts and their role for agroecological transitions. Agroecology and Sustainable Food Systems, 46(8): 1198-1223. DOI: https://doi.org/10.1080/21683565.2022.210442.
Pindado E., Sánchez M. (2017). Researching the entrepreneurial behaviour of new and existing ventures in European agriculture. Small Business Economics, 49: 421-444. DOI https://doi.org/10.1007/s11187-017-9837-y.
Poponi S., Arcese G., Mosconi E.M., Pacchera F., Martucci O., Elmo G.C. (2021). Multi-actor governance for a circular economy in the agri-food sector: bio-districts. Sustainability, 13: 4718. DOI: https://doi.org/10.3390/su13094718.
Rete Rurale Nazionale (2011). Verso la consulenza alla gestione attraverso la RICA. Creazione di gruppi omogenei di imprese e verifica dei risultati economici, Working Paper, Rome.
Russo C., Sabbatini M. (2005). Analisi esplorativa delle differenziazioni strategiche nelle aziende agricole, REA-Rivista di Economia Agraria, 4.
Salvador S., Chan P. (2004). Determining the number of clusters/segments in hierarchical clustering/segmentation algorithms. In Proceedings - International Conference on Tools with Artificial Intelligence, ICTAI (pp. 576-584). DOI: https://doi.org/10.1109/ICTAI.2004.50.
Salvioni C., Ascione E., Henke R. (2013). Structural and economic dynamics in diversified Italian farms. Bio-Based and Applied Economics, 2(3): 257-275. DOI: https://doi.org/10.13128/BAE-13094.
Salvioni C., Henke R., Vanni F. (2020). The impact of non-agricultural diversification on financial performance: evidence from family farm in Italy. Sustainability, 12(2): 486. DOI: https://doi.org/10.3390/su12020486.
Sardone R. (2012). Dieci anni di agricoltura italiana: le principali evidenze dell’Annuario Inea. Agriegionieuropa, 29: 66-70.
Schnebelin É. (2022). Linking the diversity of ecologisation models to farmers’ digital use profiles, Ecological Economics, 196: 107422. DOI: https://doi.org/10.1016/j.ecolecon.2022.107422.
Seuneke P., Lans T., Wiskerke J.S.C. (2013). Moving beyond entrepreneurial skills: key factors driving entrepreneurial learning in multifunctional agriculture, Journal of Rural Studies, 32: 208-219. DOI: https://doi.org/10.1016/j.jrurstud.2013.06.001.
Sotte F., Brunori G. (2025) (eds.). European Agricultural Policy. History and Analysis, Springer International Publishing AG.
Vandermersch M., Mathijs E. (2002). Do management profiles matter? An analysis of Belgian dairy farmers. 2002 International Congress of European Association of Agricultural Economists, August 28-31, Zaragoza, Spain.
van der Ploeg J.D., Laurent C., Blondeau F., Bonnafous P. (2009). Farm diversity, classification schemes and multifunctionality. Journal of Environmental Management, 90(Suppl 2): S124-S131. DOI: https://doi.org/10.1016/j.jenvman.2008.11.022.
Vanni F. (2013). Agriculture and Public Goods. The Role of Collective Action. Springer, Dordrecht.
Weltin M., Zasada I., Franke C., Piorr A., Raggi M., Viaggi D. (2017). Analysing behavioural differences of farm households: An example of income diversification strategies based on European farm survey data, Land Use Policy, 62: 172-184. DOI: https://doi.org/10.1016/j.landusepol.2016.11.041.
Xu C., Wang Q., Fahad S., Kagatsume M., Yu J. (2022). Impact of off-farm employment on farmland transfer: insight on the mediating role of agricultural production service outsourcing. Agriculture, 12(10), 1617. DOI: https://doi.org/10.3390/agriculture12101617.
| Thematic areas | Variables | Classes | Entrepreneurial Level |
||||||||||||||||
|---|---|---|---|---|---|---|---|---|---|---|---|---|---|---|---|---|---|---|---|
| Market relations | % Sales revenue % Self-consumption |
- Sales >0% and self-consumption <100% (active farms [Afs]) - Sales = 0% and self-consumption = 100% |
* * |
||||||||||||||||
| Human capital | Age of the farm manager | - ≤40 years - 41-67 years - >67 years |
Medium High Low |
||||||||||||||||
| Management experience | - <3 years - 3-10 years - >10 years |
Low Medium High |
|||||||||||||||||
| Education level | - Up to middle school - Diploma and degree from an agricultural school - Diploma and degree from other schools |
Low High Medium |
|||||||||||||||||
| Economic size and production orientation |
Standard output | - <8,000 euros - 8,000-25,000 euros - 25,000-100,000 euros- >100,000 euros |
* Low MediumHigh |
||||||||||||||||
| Type of farming | - Field crops (1-2) - Permanent crops (3) - Livestock (4-5)- Mixed (6-9) |
Low High HighMedium |
|||||||||||||||||
| Organic certification | - Yes - No |
High Medium |
|||||||||||||||||
| Work organisation | Extra-family work force | - None - Less than family work force (<50%) - Equal or more than family work force (≥50%) |
Low Medium High |
||||||||||||||||
| Outsourcing services | - Yes - No |
Medium High |
|||||||||||||||||
| Off-farm work commitments of the manager | - ≥ 50% of work amount - < 50% of work amount - None |
Low Medium High |
|||||||||||||||||
| Strategic entrepreneurial orientation | Participation in associations | - None - Only producers’ organisation - Various associations |
Low Medium High |
||||||||||||||||
| Related agricultural activities (diversification) | - None - Only broadening activities - Only deepening activities- Multiple activities |
Low Medium MediumHigh |
|||||||||||||||||
| Innovation investments | - None - Only technical - Only management- Both |
Low Medium MediumHigh |
|||||||||||||||||
| Information technology tools | - None - Only technical - Only management- Both |
Low Medium MediumHigh |
|||||||||||||||||
| Leased land | - None - <25% of utilised agricultural area - ≥25% of utilised agricultural area |
High Medium Low |
|||||||||||||||||
| Note: * used for preliminary selection. | |||||||||||||||||||
| Source: elaborations based on the ISTAT Agricultural Census, 2020. | |||||||||||||||||||
| Variables and classes | Age | ≤40 years | … | ||||||||||||||||
|---|---|---|---|---|---|---|---|---|---|---|---|---|---|---|---|---|---|---|---|
| Economic size | 25,000-100,000 euros | ≥100,000 euros | … | ||||||||||||||||
| Type of farming | Field crops | Permanent crops | Livestock | Mixed | Field crops | Permanent crops | Livestock | Mixed | … | ||||||||||
| Off-farm work commitments of the manager | ≥ 50% of work amount | 9.6 | 12.3 | 8.2 | 8.2 | 5.6 | 4.3 | 2.7 | 3.9 | … | |||||||||
| < 50% of work amount | 10.5 | 11.6 | 9.4 | 12.1 | 9.5 | 11.9 | 6.4 | 8.1 | … | ||||||||||
| None | 79.9 | 76.1 | 82.4 | 79.7 | 84.9 | 83.7 | 90.9 | 88 | … | ||||||||||
| Outsourcing services | Yes | 35.8 | 18 | 16.8 | 31.2 | 34.2 | 31.4 | 34 | 39.4 | … | |||||||||
| No | 64.2 | 82 | 83.2 | 68.8 | 65.8 | 68.6 | 66 | 60.6 | … | ||||||||||
| Management experience | <3 years | 19.1 | 17.8 | 17.9 | 18.9 | 14.6 | 13.4 | 16.3 | 11.8 | … | |||||||||
| 3-10 years | 54.8 | 56 | 49.9 | 53.6 | 51.4 | 52.4 | 46.8 | 49.9 | … | ||||||||||
| ≥10 years | 26.1 | 26.3 | 32.2 | 27.5 | 34 | 34.1 | 36.9 | 38.3 | … | ||||||||||
| … | … | … | … | … | … | … | … | … | … | … | |||||||||
| Source: elaborations based on the ISTAT Agricultural Census, 2020. | |||||||||||||||||||
| Variables | Classes | Profiles | |||||||||||||||||
|---|---|---|---|---|---|---|---|---|---|---|---|---|---|---|---|---|---|---|---|
| 1 | 2 | 3 | 4 | 5 | 6 | 7 | 8 | 9 | |||||||||||
| Off-farm work commitments of the manager | ≥50% of work amount | 19 | 5 | 9 | 3 | 6 | 17 | 4 | 23 | 4 | |||||||||
| <50% of work amount | 9 | 10 | 10 | 5 | 9 | 7 | 2 | 6 | 2 | ||||||||||
| none | 71 | 85 | 81 | 92 | 85 | 76 | 94 | 71 | 94 | ||||||||||
| Outsourcing services | Yes | 23 | 34 | 28 | 46 | 38 | 26 | 23 | 48 | 57 | |||||||||
| No | 77 | 66 | 72 | 54 | 62 | 74 | 77 | 52 | 44 | ||||||||||
| Management experience | <3 years | 19 | 14 | 18 | 3 | 3 | 5 | 2 | 6 | 3 | |||||||||
| 3-10 years | 51 | 52 | 53 | 12 | 16 | 22 | 10 | 24 | 11 | ||||||||||
| >10 years | 29 | 35 | 29 | 86 | 80 | 73 | 88 | 70 | 87 | ||||||||||
| Age of the farm manager | ≤40 years | 100 | 100 | 100 | 0 | 0 | 0 | 0 | 0 | 0 | |||||||||
| 41-67 years | 0 | 0 | 0 | 67 | 89 | 100 | 0 | 100 | 0 | ||||||||||
| >67 years | 0 | 0 | 0 | 34 | 11 | 0 | 100 | 0 | 100 | ||||||||||
| Education level | Until middle school | 24 | 17 | 21 | 65 | 42 | 51 | 76 | 48 | 75 | |||||||||
| Diploma and degree from an agricultural school | 21 | 33 | 27 | 14 | 23 | 13 | 5 | 11 | 5 | ||||||||||
| Diploma and degree from other schools | 55 | 50 | 52 | 21 | 35 | 36 | 19 | 40 | 20 | ||||||||||
| Standard output | 8,000-25,000 euros | 74 | 0 | 0 | 0 | 0 | 32 | 57 | 100 | 64 | |||||||||
| 25,000-100,000 euros | 26 | 0 | 79 | 0 | 0 | 68 | 43 | 0 | 36 | ||||||||||
| >100,000 euros | 0 | 100 | 22 | 100 | 100 | 0 | 0 | 0 | 0 | ||||||||||
| Type of farming | Field crops | 23 | 42 | 27 | 15 | 38 | 20 | 0 | 72 | 75 | |||||||||
| Permanent crops | 28 | 42 | 37 | 0 | 49 | 53 | 84 | 0 | 0 | ||||||||||
| Livestock | 36 | 0 | 22 | 80 | 0 | 20 | 16 | 0 | 0 | ||||||||||
| Mixed | 13 | 16 | 15 | 5 | 13 | 8 | 0 | 28 | 25 | ||||||||||
| Extra-family work force | None | 84 | 37 | 63 | 57 | 35 | 76 | 79 | 90 | 90 | |||||||||
| Less than family work force | 9 | 33 | 23 | 28 | 33 | 15 | 11 | 5 | 5 | ||||||||||
| Equal or more than family work force | 7 | 31 | 14 | 16 | 32 | 10 | 10 | 5 | 6 | ||||||||||
| Participation in associations | None | 53 | 37 | 47 | 39 | 35 | 46 | 47 | 53 | 50 | |||||||||
| Only producers’ organisation | 12 | 19 | 16 | 14 | 19 | 15 | 17 | 9 | 10 | ||||||||||
| Various associations | 35 | 44 | 38 | 47 | 46 | 39 | 36 | 38 | 40 | ||||||||||
| Other gainful activities (diversification) |
None | 87 | 83 | 86 | 85 | 82 | 89 | 96 | 91 | 95 | |||||||||
| Only broadening activities | 5 | 6 | 6 | 7 | 8 | 5 | 2 | 5 | 3 | ||||||||||
| Only deepening activities | 5 | 8 | 6 | 6 | 7 | 4 | 1 | 3 | 2 | ||||||||||
| Multiple activities | 3 | 4 | 3 | 3 | 4 | 2 | 1 | 2 | 1 | ||||||||||
| Innovation investments | None | 77 | 54 | 66 | 66 | 59 | 81 | 90 | 89 | 92 | |||||||||
| Only technical | 18 | 36 | 26 | 27 | 33 | 16 | 9 | 9 | 7 | ||||||||||
| Only management | 1 | 1 | 1 | 1 | 1 | 0 | 0 | 0 | 0 | ||||||||||
| Both | 5 | 9 | 7 | 7 | 7 | 3 | 1 | 2 | 1 | ||||||||||
| Information technology tools | None | 67 | 42 | 54 | 48 | 46 | 71 | 87 | 78 | 86 | |||||||||
| Only technical | 4 | 4 | 5 | 10 | 4 | 3 | 1 | 2 | 1 | ||||||||||
| Only management | 15 | 28 | 21 | 13 | 27 | 15 | 7 | 12 | 7 | ||||||||||
| Both | 14 | 27 | 20 | 29 | 23 | 11 | 4 | 8 | 5 | ||||||||||
| Organic certification | Yes | 17 | 24 | 23 | 12 | 19 | 14 | 10 | 8 | 6 | |||||||||
| No | 83 | 76 | 77 | 88 | 81 | 86 | 91 | 92 | 94 | ||||||||||
| Leased land | none | 40 | 22 | 27 | 30 | 35 | 54 | 79 | 56 | 67 | |||||||||
| <25% of utilised agricultural area | 4 | 8 | 6 | 10 | 12 | 7 | 5 | 6 | 7 | ||||||||||
| ≥25% of utilised agricultural area | 56 | 71 | 67 | 60 | 53 | 39 | 16 | 38 | 26 | ||||||||||
| Note: the sum of the classes per indicator and profile calculated and rounded to one decimal place is always 100%. The values in the table are rounded to the nearest whole number, so the sum of the values can different slightly from 100. Min = minimum row share value, max = maximum row share value | |||||||||||||||||||
| Source: elaborations based on the ISTAT Agricultural Census, 2020. | |||||||||||||||||||
1 Where sales cover all possible commercial channels used for income generation.
2 To extract and organise the census data we used SAS version 9.4.
3 We used the Complete linkage algorithm with Euclidean distance calculated using the Hclust procedure in R (version 4.4.1).
4 In particular, age is one of the most analysed entrepreneurial factors in the agricultural literature and often considered as crucial for farms development (Graskemper et al., 2021b). Furthermore, farmers under 40 years old can access European contributions specifically for young agricultural entrepreneurs, as a target of specific policies within the Common Agricultural Policy (CAP).
5 We determined the number of clusters by analysing the dendrogram to identify the distance at which observations are most similar to each other but dissimilar from those of the other groups (branch length). A smaller distance would have generated excessive fragmentation of the groups (with one consisting of a single observation), while a greater distance would have aggregated the visibly different groups 8 and 9. This is an empirical method widely used in the literature for hierarchical clustering (Boyko, Tkachyk, 2023; Salvador, Chan, 2004).
6 The Approximately Unbiased (AU) p-value is a parameter calculated using multiscale bootstrap resampling (R procedure PVclust) to estimate of a cluster’s strength compared to the standard bootstrap probability. For most clusters, the parameter values exceeded 90%, indicating the high reliability of the clustering results. Only the seventh cluster showed lower stability and was more sensitive to variability in the input data.
7 We specifically selected studies that aimed to outline entrepreneurial strategies; however, due to their diverse methodologies and data sources, we could only perform a qualitative, rather than a quantitative, comparison.
8 Less-favoured area (LFA).