Research article
Enhancing food accessibility and affordability in rural Mali through mobile money
1 Ege University, Faculty of Agriculture, Department of Agricultural Economics, Izmir, Türkiye
2 Isparta University of Applied Sciences, Faculty of Agriculture, Department of Agricultural Economics, Türkiye
*Corresponding author. E-mail: seun.bamiji.adeoye@outlook.com
Abstract. This study examines how mobile money adoption influences food accessibility in rural Mali, a context marked by limited financial infrastructure and persistent food insecurity. Using household-level survey data from Koulikoro and a composite food insecurity index – the Household Food Insecurity Access Scale (HFIAS) – we apply censored Tobit regression to identify the effect of mobile money use on household food access. The results show that mobile money significantly reduces food insecurity, with users reporting lower HFIAS scores than non-users. Other key determinants include income, land ownership, and education, particularly at the university level. However, gender disparities and land tenure insecurity constrain the full benefits of digital finance. Policy responses should prioritise financial inclusion for women, formalise land rights, and expand digital remittance platforms to enhance rural resilience. Aligning mobile money expansion with broader institutional reforms can strengthen food security outcomes in Mali’s rural communities.
Keywords: mobile money, food accessibility, rural digitisation, financial inclusion, Mali.
JEL codes: Q18, O33, G21, R20, R51.
Index
2.2. Data collection and sampling procedure
2.3. Assessing food insecurity in Mali’s MM context
2.4. Generating an HFIAS indicator
3.2. Censored Tobit regression findings
5. Conclusion and recommendations
– Mobile money usage significantly reduces household food insecurity in rural Mali.
– Households receiving mobile money remittances report higher food access and lower Household Food Insecurity Access Scale scores.
– Contextual factors such as village location are crucial, revealing significant geographic heterogeneity in food security outcomes that must be accounted for in analysis.
There has been a growing interest in the convergence of technology and agricultural sustainability (Kabbiri et al., 2018). Mobile money (MM) – a digital financial service that enables transactions through basic mobile phones without requiring internet access or bank accounts – has emerged as a tool that can enhance food accessibility in rural areas (David-West et al., 2019; Wieser et al., 2019). Ensuring food security is paramount, especially in remote areas where limited resources, long distances from markets, and a lack of banking access increase vulnerability (Piaskoski et al., 2020; Rural Health Information Hub, 2023). Food security in Mali remains a major issue: although consistent access to nutritious food is required to live an active, healthy life (Zenk et al., 2022), rural households face systemic challenges such as financial inclusion gaps compared with urban areas (Piaskoski et al., 2020). Financial inclusion fosters inclusive growth and improves food security (Ashrad, 2022), as has been shown by studies linking financial access to household resilience (Huang, Nik Azman, 2023). However, the relationship between financial inclusion and food security remains underexplored, particularly in developing contexts.
Rural areas, such as what can be found in Mali, are often financially excluded (Amadou, 2018). MM operates via local agent networks (Guérin et al., 2014) to facilitate secure transfers, bill payments, and savings via simple SMS or USSD technology (Wantchekon, Riaz, 2019). Its low-cost, real-time transaction capabilities have proven especially valuable for rural populations, farmers, and women who have traditionally lacked access to formal banking services. There is evidence from Uganda which shows the potential of MM to reduce food insecurity (Bruhn, 2019; Dunne, Kasekende, 2017; Wantchekon, Riaz, 2019). Additional evidence suggests the potential of MM systems to revolutionise participation in rural markets (Menekse, 2011; Murendo, Wollni, 2016; O’Hara, Toussaint, 2021).
In this study, we examine how MM adoption influences access to food in rural Mali by analysing key socio-economic factors including gender, education, and land ownership. We address three central questions: (1) how does MM technology affect household food security? (2) Through what mechanisms does it improve food security? (3) Which socio-economic variables have the most significant impact on its effectiveness? Our investigation of these relationships contributes to an understanding of how digital financial tools can enhance rural resilience while providing actionable insights for policies aimed at strengthening food security in vulnerable communities. This study lays the foundation for exploring innovative solutions to address food accessibility issues in rural regions, including local development and capacity-building initiatives. This interdisciplinary endeavour requires the integration of elements from economics, technology, agriculture, sociology, and food safety, making it a stimulating and challenging research topic. The outcomes of this study could directly inform the design of development policies and programmes aimed at bolstering food resilience in rural communities.
The relationship between MM, financial inclusion, and food security has been widely studied in development economics, rural studies, and research of food systems. Scholars argue that mobile financial services can reduce economic vulnerabilities by facilitating access to remittances, reducing transaction costs, and improve a household’s ability to cope with shocks. However, it is important to distinguish between financial circulation and access to food to understand the specific routes through which MM affects food security. While financial circulation refers to the flow of monetary resources enhanced by mobile platforms, food access entails the physical and economic capacity to get adequate and nutritious food.
The literature rooted in financial inclusion theory, particularly the entitlement approach (Sen, 1999) and financial access theory (Morduch, 1999), provides a foundation to understand how MM increases the access of food. Sen’s (1999) approach emphasises the individual’s ability to transform resources into well-being, where financial tools are essential for expanding personal freedoms and choices. In this context, MM acts as a facilitator that broadens economic capabilities by offering a household the means to secure food. Morduch’s (1999) financial access principle suggests that financial services increase economic participation, which can translate into better domestic welfare and consumption patterns. These theoretical perspectives have inspired empirical studies examining the effects of MM services on rural livelihoods.
Empirical evidence shows that MM enables households to face food insecurity by increasing liquidity and smoothing consumption. Remittance flow through mobile platforms acts as informal form of insurance against a lack of food, especially in agricultural settings where income is unstable. Wantchekon, Riaz (2019) reported that MM remittance helps rural families manage seasonal shortage and price spikes. Marando, Volni (2016) found that MM increases the expenditure and dietary diversity related to food between farming houses in Zimbabwe. These findings suggest that MM improves the economic access pillar of food security by boosting the household’s purchasing power.
Moreover, MM contributes to food security by enabling participation in regional markets. As shown in the study of Uganda and Tanzania (Naito et al., 2021; Weiser et al., 2019; Yao et al., 2022), mobile platforms reduce the cost of sending and receiving funds, which facilitates trade and improves supply chains. These benefits, in turn, support the availability of food by improving access to more diverse and reliable sources of food. Yao et al. (2023) further emphasised that MM enables market access and also strengthens the ability of rural families to respond to the shock, including value volatility and climate disruptions.
Other scholars have emphasised the importance of contextual variables such as income, the education level, household composition, and infrastructural reach. For example, Diallo et al. (2021) demonstrated that higher education and income increase the likelihood of MM adoption, which correlates with improved food access. Conversely, Aron (2018) found that structural barriers such as poor mobile coverage in remote regions limit the effectiveness of MM in enhancing food security. These studies highlight the importance of differentiating between the potential and realised impacts of financial tools.
According to food security frameworks (Barrett, 2002; Sassi et al., 2018), availability, access, stability, and utilisation are distinct pillars. MM primarily affects the access dimension by improving financial resources and market connectivity. However, it may also influence utilisation by enabling purchases of higher-quality food and health-related goods and services. These dynamics are especially relevant in settings like Mali, where food insecurity is closely tied to both economic constraints and limited infrastructure. Hence, our focus is on access and utilisation. We adopt the Household Food Insecurity Access Scale (HFIAS) proposed by Food and Agricultural Organization of the United Nations (FAO) (FAO, 2007) to explore these factors.
Based on our literature review, we hypothesise that MM plays a dual role in reducing rural vulnerability. First, it serves as a financial instrument that facilitates monetary flows. Second, it is a mechanism that enhances food security through better access and adaptive capacity. This duality is shaped by socio-economic inequalities and institutional factors, which may amplify or constrain the potential benefits of digital finance. By engaging with both theoretical and empirical work, we seek to clarify how MM impacts food access in the specific context of rural Mali.
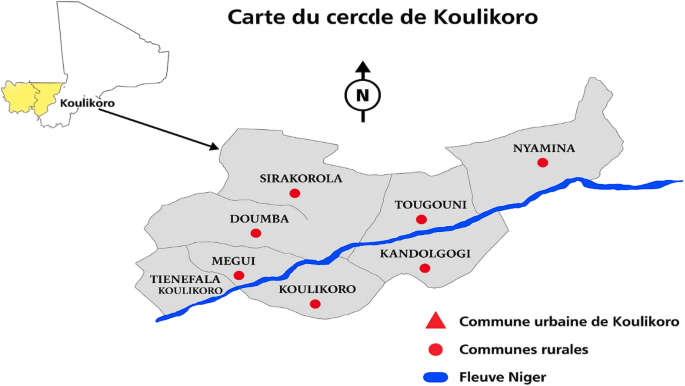
Koulikoro, a strategically important region in southwestern Mali, serves as a key administrative and transportation hub in West Africa. Situated along the Niger River, it connects major routes, including the Bamako-Dakar railway and hosts the vital Koulikoro Training Centre (Figure 1). The region features a blend of urban centres and rural landscapes, with agriculture driving its economy. Its diverse population includes Bambara, Malinke, and Soninke ethnic groups, creating a rich cultural mosaic.
2.2. Data collection and sampling procedure
Researchers from the Institut Polytechnique Rural de Formation et de Recherche Appliquée (IPR/IFRA) in Katibougou conducted the survey across three rural Malian villages between August and September 2023. Twenty trained university students collected data through face-to-face interviews using Kobotoolbox and a customised questionnaire, with preliminary testing to ensure question clarity.
Using the Newbold (1995) formula (Equation 1) with 2010 population data (United Nations, 2021), we selected 328 households from a sampling frame of 1,047 through random sampling with local stakeholder assistance. We evaluated the impact of MM on rural food accessibility.
(1)
Where:
n = sample volume.
N = number of rural households in the study area.
p = 0.5 (for the maximum sample size, the estimated proportion of households aware of MM use).
p = the ratio variance (calculated as 1.645 × σp = 0.05 for a 90% confidence interval [CI] with a margin of error of 0.03; p = 0.03039).
We randomly sampled 328 households across three Koulikoro villages: Diakitébougou (n = 101), Mamibougou (n = 110), and Katibougou (n = 109). With a 95% confidence level and 5% margin of error, the sample size ranged from 307 to 382 from a population of 1,047 households. After data cleaning, 298 valid responses were retained for analysis.
Data collection used simple random sampling. IBM SPSS Statistics Version 24 was used to calculate descriptive statistics. R was used to construct the HFIAS and for Tobit regression analysis.
2.3. Assessing food insecurity in Mali’s MM context
The survey assessed five major areas: (1) demographics, (2) MM use, (3) food insecurity, (4) ease of MM use, and (5) affordability and food access. We adapted the HFIAS to the Malian context: we maintained the main dimensions (anxiety, quantity, quality, and coping strategies) but used a 5-point Likert scale (from 1 [never] to 5 [always]) instead of the original 4-point scale. This modification better captures Mali’s food insecurity and thus improves the accuracy of the responses. We calculated the severity threshold (secure/mild/moderate/severe) using the Mali-specific nutrition benchmarks to ensure our findings are relevant to the local context and amendable to global comparisons. Our 5-point scale provides the following important benefits:
– Better identification of respondents at risk (4 [often]) versus in chronic hunger (5 [always]).
– Captures seasonal variations in food insecurity.
– Provides more accurate data to evaluate the effect of MM on food access.
This cultural adaptation of HFIAS enables more targeted food security interventions by maintaining strict measurement standards for the Mali’s MM context (Harknes et al., 2010).
2.4. Generating an HFIAS indicator
The six key questions (Q27-Q32) described in Table 1 were scored from 1 (never) to 5 (always). Then, the score for each question was added together to obtain a composite index (Equation 2).
(2)
| HFIAS domain | Our questions | Response scale | Comparison |
|---|---|---|---|
| Anxiety about food supply | Q31 (worry about running out) | 5-point Likert | Measures the psychological aspect of food insecurity |
| Reduced food quantity | Q28 (ate less) | 5-point Likert | Measures the ‘quantity’ dimension of the HFIAS |
| Q32 (went to bed hungry) | 5-point Likert | Measures the severe food deprivation indicator of the HFIAS | |
| Reduced food quality | Q29 (ate less healthy) | 5-point Likert | Measures ‘quality’ compromise due to affordability |
| Coping strategies | Q30 (borrowed money) | 5-point Likert | Measuring financial coping mechanisms, which aligns with the HFIAS: ‘reliance on less preferred foods’ |
| Access barriers | Q27 (difficulty accessing) | 5-point Likert | Capture general access barriers (e.g., the HFIAS ‘food shortage’ items) |
Each question received equal weighting because these six questions collectively capture food access challenges. The total score ranges from 6 (food secure) to 30 (severely food insecure), with higher scores indicating greater food insecurity. We categorised this score into four levels:
– Food secure (6-10): no meaningful food access limitations.
– Mild insecurity (11-15): occasional worries about food supply without reduced intake.
– Moderate insecurity (16-20): regular reductions in food quality and/or quantity.
– Severe insecurity (>20): frequent hunger experiences including skipped meals
This approach followed the standard HFIAS methodology (Kotts et al., 2007) while adapting it to the Malian context.
From the initial 310 respondents, we obtained complete HFIAS data for 298 households (96.3% completion rate). The adapted scale demonstrated strong reliability, with Cronbach’s alpha of 0.89 and an average inter-item correlation of 0.58. Sensitivity analysis confirmed the importance of each question, as removing any single item would not improve reliability. These results validate our adapted scale as a robust measure of food insecurity in rural Mali.
To investigate the effect of MM use on HFIAS, we utilised censored Tobit regression (Equation 3):
(3)
where:
is the latent (unobserved) household food insecurity score.
is the observed score, censored at 6 (lower limit) and 30 (upper limit).
is the vector of explanatory variables.
The use of censored Tobit regression is justified because the HFIAS variable is a bounded variable; using ordinary least squares regression would yield biased estimates (Greene, 1983). Censored Tobit regression estimates both the probability of censoring and the conditional mean of the uncensored observations (Greene, 1983).
We must emphasise that, while this study provides useful information about how MM can help improve food security in rural Mali, it has limitations. We utilise self-reported data for both MM use and food insecurity (HFIAS), which could lead to recall or social desirability bias. Second, the cross-sectional design makes it difficult to draw conclusions about cause and effect. Longitudinal studies could better show how MM adoption and food security change over time. Third, the study is limited to Koulikoro, which is typical of rural Mali but may not be true for areas that have been affected by conflict or have different climates. Finally, we did not consider how food access or MM use patterns change with the seasons, which could have an effect on the results.
We used cross tabulation to explore the relationship between socio-economic factors (e.g. gender, education, age, occupation, and MM usage). Based on the results presented in Table 2, household food security status is significantly associated with several key factors. Geographical location exhibits a strong association (p < 0.001), with the food security rate, which varies widely from 27.8% in Mamibougou to 70.3% in Diakitébougou, indicating the crucial role of local context. Land ownership is also a significant differentiator (p = 0.009), with landowners experiencing markedly higher food security (62.4%) than non-landowners (43.0%), underscoring land’s role as a critical productive asset. The education level is also significant (p = 0.007), as a university education correlates with improved food security, likely by enhancing livelihood opportunities and access to information.
| Variable | Category | Food secure (n = 154) | Mild insecurity (n = 46) | Moderate insecurity (n = 43) | Severe insecurity (n = 55) | p-value | Significant? | ||||||||||||
|---|---|---|---|---|---|---|---|---|---|---|---|---|---|---|---|---|---|---|---|
| Location | Diakitébougou | 64 (70.3%) | 1 (1.1%) | 0 (0%) | 26 (28.6%) | <0.001*** | Yes | ||||||||||||
| Katibougou | 60 (60.6%) | 5 (5.1%) | 17 (17.2%) | 17 (17.2%) | |||||||||||||||
| Mamibougou | 30 (27.8%) | 40 (37.0%) | 26 (24.1%) | 12 (11.1%) | |||||||||||||||
| Gender | Female | 60 (48.8%) | 18 (14.6%) | 17 (13.8%) | 28 (22.8%) | 0.460 | No | ||||||||||||
| Male | 94 (53.7%) | 28 (16.0%) | 26 (14.9%) | 27 (15.4%) | |||||||||||||||
| Marital status | Married | 102 (51.5%) | 32 (16.2%) | 33 (16.7%) | 31 (15.7%) | 0.380 | No | ||||||||||||
| Single | 49 (52.7%) | 12 (12.9%) | 9 (9.7%) | 23 (24.7%) | |||||||||||||||
| Widow/widower | 3 (42.9%) | 2 (28.6%) | 1 (14.3%) | 1 (14.3%) | |||||||||||||||
| Land ownership | No | 71 (43.0%) | 29 (17.6%) | 27 (16.4%) | 38 (23.0%) | 0.009** | Yes | ||||||||||||
| Yes | 83 (62.4%) | 17 (12.8%) | 16 (12.0%) | 17 (12.8%) | |||||||||||||||
| Education level | Primary | 33 (37.1%) | 15 (16.9%) | 18 (20.2%) | 23 (25.8%) | 0.007** | Yes | ||||||||||||
| Secondary | 46 (52.3%) | 18 (20.5%) | 13 (14.8%) | 11 (12.5%) | |||||||||||||||
| University | 75 (62.0%) | 13 (10.7%) | 12 (9.9%) | 21 (17.4%) | |||||||||||||||
| Occupation | Farmer | 28 (46.7%) | 11 (18.3%) | 12 (20.0%) | 9 (15.0%) | 0.769 | No | ||||||||||||
| Trader | 23 (41.8%) | 11 (20.0%) | 7 (12.7%) | 14 (25.5%) | |||||||||||||||
| Other | 94 (57.0%) | 20 (12.1%) | 22 (13.3%) | 29 (17.6%) | |||||||||||||||
| Mobile money usage | No | 13 (18.6%) | 8 (11.4%) | 9 (12.9%) | 40 (57.1%) | <0.001*** | Yes | ||||||||||||
| Yes | 141 (61.8%) | 38 (16.7%) | 34 (14.9%) | 15 (6.6%) | |||||||||||||||
| Mobile money use duration | <3 months | 10 (58.8%) | 2 (11.8%) | 3 (17.6%) | 2 (11.8%) | 0.862 | No | ||||||||||||
| >6 months | 130 (50.0%) | 42 (16.2%) | 40 (15.4%) | 48 (18.5%) | |||||||||||||||
| Mobile money acceptance | No | 7 (50.0%) | 3 (21.4%) | 3 (21.4%) | 1 (7.1%) | 0.600 | No | ||||||||||||
| Yes | 147 (51.8%) | 43 (15.1%) | 40 (14.1%) | 54 (19.0%) | |||||||||||||||
| MM reliability | No | 90 (49.5%) | 31 (17.0%) | 27 (14.8%) | 34 (18.7%) | 0.732 | No | ||||||||||||
| Yes | 64 (55.2%) | 15 (12.9%) | 16 (13.8%) | 21 (18.1%) | |||||||||||||||
| Continue to use mobile money | No | 5 (38.5%) | 2 (15.4%) | 4 (30.8%) | 2 (15.4%) | 0.112 | No | ||||||||||||
| Yes | 142 (52.0%) | 44 (16.1%) | 39 (14.3%) | 48 (17.6%) | |||||||||||||||
| Mobile money cultural perception | Yes | 148 (52.3%) | 43 (15.2%) | 43 (15.2%) | 49 (17.3%) | 0.076 | Yes | ||||||||||||
| No | 6 (40.0%) | 3 (20.0%) | 0 (0.0%) | 6 (40.0%) | |||||||||||||||
| Note: ***p < 0.01; **p < 0.05. | |||||||||||||||||||
Most notably, the use of MM services demonstrates a powerful positive relationship with food security (p < 0.001). MM users are substantially more food secure (61.8%) and experience a far lower rate of severe food insecurity (6.6%) compared with non-users. This suggests that financial inclusion via digital platforms may bolster resilience by facilitating access to financial resources. In contrast, factors such as gender, marital status, and specific MM service attributes show no significant associations. Overall, the results underscore the multifaceted nature of food security, highlighting the critical importance of geography, asset ownership, education, and financial inclusion in shaping household-level outcomes.
Table 3 explores the relationship between how the respondents rate the effects of MM on food access and their level of food insecurity. Both the Pearson chi-square test (χ² = 20.013, degrees of freedom [df] = 12, p = 0.067) and the likelihood ratio test (likelihood ratio = 20.849, df = 12, p = 0.053) show a trend for statistical significance, suggesting a weak association. The majority across all food insecurity groups rated the MM impact as 4, indicating a perceived strong benefit. This is especially pronounced among the severely food insecure group, where 60.9% selected this rating. The food secure respondents were more likely to rate MM impact as 5 (33.3%), in contrast to just 6.5% in the severe group. These results imply that while MM is widely perceived as beneficial for food access, the strength of this perception varies across food security levels, with some indication that those with higher insecurity are more cautious in assigning the highest benefit rating.
| Self-rated mobile money effect on food access | Food secure | Mild insecurity | Moderate insecurity | Severe insecurity | Total | Row % | |||||||||||||
|---|---|---|---|---|---|---|---|---|---|---|---|---|---|---|---|---|---|---|---|
| 0 (No benefit) | 0 (0.0%) | 0 (0.0%) | 0 (0.0%) | 0 (0.0%) | 0 | 0.0 | |||||||||||||
| 1 | 0 (0.0%) | 0 (0.0%) | 0 (0.0%) | 0 (0.0%) | 0 | 0.0 | |||||||||||||
| 2 | 0 (0.0%) | 35 (24.3%) | 10 (22.7%) | 9 (19.6%) | 54 | 22.0 | |||||||||||||
| 3 | 2 (16.7%) | 21 (14.6%) | 5 (11.4%) | 6 (13.0%) | 34 | 13.8 | |||||||||||||
| 4 | 6 (50.0%) | 76 (52.8%) | 19 (43.2%) | 28 (60.9%) | 129 | 52.4 | |||||||||||||
| 5 (Max benefit) | 4 (33.3%) | 12 (8.3%) | 10 (22.7%) | 3 (6.5%) | 29 | 11.8 | |||||||||||||
| Total | 12 (100.0%) | 144 (100.0%) | 44 (100.0%) | 46 (100.0%) | 246* | 100 | |||||||||||||
| Note: *The total number is less than 298 due to missing observations. | |||||||||||||||||||
Table 4 examines how self-rated perceptions of MM benefits vary by household food insecurity status. The Pearson chi-square test indicates there is not a significant association (χ² = 27.806, df = 20, p = 0.114), but the likelihood ratio test suggests a marginal association (likelihood ratio = 31.576, df = 20, p = 0.048). The distribution shows that individuals experiencing mild or moderate food insecurity report stronger perceived benefits from MM. For example, 18.8% of the respondents in the mild food insecurity category rated the benefits of MM as 4, and 6.0% rated it as 5. In comparison, the respondents in the food secure category were more likely to report either no benefit or minimal impact, with 10 out of 12 assigning a rating below 4. These patterns may indicate that those facing food-related challenges perceive digital financial services as helpful tools in accessing or securing food, though the association is not uniformly strong across all groups.
| Perceived mobile money benefit | Food secure | Mild insecurity | Moderate insecurity | Severe insecurity | Total |
|---|---|---|---|---|---|
| 0 (No benefit) | 2 (0.7%) | 0 (0.0%) | 1 (0.3%) | 0 (0.0%) | 3 |
| 1 | 1 (0.3%) | 26 (8.7%) | 8 (2.7%) | 6 (2.0%) | 42 |
| 2 | 0 (0.0%) | 20 (6.7%) | 5 (1.7%) | 9 (3.0%) | 41 |
| 3 | 1 (0.3%) | 30 (10.1%) | 6 (2.0%) | 8 (2.7%) | 55 |
| 4 | 10 (3.4%) | 56 (18.8%) | 14 (4.7%) | 22 (7.4%) | 119 |
| 5 (Max benefit) | 0 (0.0%) | 18 (6.0%) | 11 (3.7%) | 4 (1.3%) | 38 |
| Total | 12 | 152 | 44 | 41 | 298 |
Table 5 presents the relationship between household food insecurity status and preference for MM relative to physical cash. The Pearson chi-square test (χ² = 59.63, df = 20, p < 0.001) and the likelihood ratio test (likelihood ratio = 62.85, df = 20, p < 0.001) indicate a significant association between the two variables. A substantial proportion of the respondents in the mild, moderate, and severe food insecurity categories expressed a greater preference for MM. Specifically, 75.7% of the respondents in the mild food insecurity category rated their preference as 4 or 5, indicating a clear shift towards MM usage. In contrast, the respondents in the food secure category predominantly prefer cash, with 10 out of 12 assigning the lowest possible score of 0. The trend suggests that food insecure households may view MM as a more reliable or accessible option for managing food needs, possibly due to its flexibility, speed, or reduced transaction barriers. This pattern supports the argument that digital financial tools may play a role in mitigating food insecurity by improving access to resources.
| Mobile money rating | Food secure | Mild insecurity | Moderate insecurity | Severe insecurity | Total | Row % |
|---|---|---|---|---|---|---|
| 0 (prefer cash) | 10 (3.4%) | 0 | 0 | 5 (1.7%) | 15 | 5.0% |
| 1 | 0 | 11 (3.7%) | 3 (1.0%) | 2 (0.7%) | 16 | 5.4% |
| 2 | 0 | 18 (6.0%) | 3 (1.0%) | 5 (1.7%) | 26 | 8.7% |
| 3 | 0 | 8 (2.7%) | 1 (0.3%) | 4 (1.3%) | 13 | 4.4% |
| 4 | 0 | 74 (24.8%) | 16 (5.4%) | 27 (9.1%) | 117 | 39.3% |
| 5 (prefer mobile money) | 2 (0.7%) | 41 (13.8%) | 21 (7.1%) | 6 (2.0%) | 70 | 23.5% |
| Total | 12 (4.0%) | 152 (51.0%) | 44 (14.8%) | 49 (16.4%) | 298 | 100% |
Table 6 presents the results of post hoc pairwise comparisons following a statistically significant Kruskal-Wallis H test, which we conducted to assess the differences in household income distributions across the four HFIAS categories. The analysis revealed a significant effect of the food security category on household income (p < .001). Next, we conducted Dunn’s pairwise tests with the Bonferroni adjustment to identify specific group differences. The mean rank differences indicate the direction and magnitude of the disparities in household income between groups. We observed a consistent and statistically significant effect between food security status and household income. The households in the food secure category have a significantly higher median household income than the mild food insecurity category (mean rank difference = 2.69, p = 0.007), the moderate food insecurity category (mean rank difference = 3.60, p = 0.001), and the severe food insecurity category (mean rank difference = 9.01, p < .001). The magnitude of this difference is most pronounced between the food secure and severe food insecurity categories. Furthermore, the households in the severe food insecurity category have a significantly lower median household income than those in the mild food insecurity category (mean rank difference = 4.82, p < 0.001) and the moderate food insecurity category (mean rank difference = 3.90, p < 0.001). However, there is not a significant difference in household income between the mild and moderate food insecurity categories (mean rank difference = 0.79, p = 0.214).
| Category comparison | Mean rank difference | Adjusted p-value | Significant? | ||||||||||||||||
|---|---|---|---|---|---|---|---|---|---|---|---|---|---|---|---|---|---|---|---|
| Food secure vs mild food insecurity | 2.694 | 0.007 | Yes | ||||||||||||||||
| Food secure vs moderate food insecurity | 3.601 | 0.001 | Yes | ||||||||||||||||
| Food secure vs severe food insecurity | 9.009 | < 0.001 | Yes | ||||||||||||||||
| Mild vs moderate food insecurity | 0.794 | 0.214 | No | ||||||||||||||||
| Mild vs severe food insecurity | 4.817 | < 0.001 | Yes | ||||||||||||||||
| Moderate vs severe food insecurity | 3.900 | < 0.001 | Yes | ||||||||||||||||
| Note: The mean rank is the average position that all the observations from a particular group (e.g., food secure) occupy when all the data from all groups are combined and sorted from lowest to highest. | |||||||||||||||||||
Table 7 shows the results of the Kruskal-Wallis test assessing differences in a variable by the frequency of MM remittances and family income. There are significant differences across the categories for both variables. For MM remittances, respondents who receive funds weekly, monthly, or quarterly have higher mean ranks compared with those receiving daily or annual remittances (H = 9.909, p = 0.042). Similarly, family income varies significantly by remittance frequency, with weekly recipients showing the highest mean rank, followed by quarterly and monthly recipients (H = 10.090, p = 0.039). These results suggest that the frequency of MM remittances is associated with variations in the measured variable and the family income levels.
| Variable | Frequency_MM_Remitt | Number | Mean Rank | Kruskal-Wallis H |
|---|---|---|---|---|
| MM_Remittance | Daily | 115 | 126.61 | 9.909 (p = 0.042) |
| Weekly | 68 | 158.12 | ||
| Monthly | 77 | 155.79 | ||
| Quarterly | 17 | 156.79 | ||
| Annually | 9 | 118.56 | ||
| Total | 286 | |||
| Family_Income | Daily | 115 | 142.21 | 10.090 (p = 0.039) |
| Weekly | 68 | 167.74 | ||
| Monthly | 77 | 130.68 | ||
| Quarterly | 17 | 134.65 | ||
| Annually | 9 | 103.28 | ||
| Total | 286 |
3.2. Censored Tobit regression findings
Table 8 provides the descriptive statistics for the variables used in the censored Tobit regression analysis. The sample consists of 298 households with no missing data.
We employed censored Tobit regression to analyse the factors influencing rural household food insecurity, operationalized by the HFIAS score – a bounded dependent variable ranging from 6 to 30. The initial model was highly significant (Wald χ²(10) = 298.2, *p* < 0.001), indicating that the collective set of predictors effectively explains variation in food insecurity. The initial model without clustered standard errors (Table 9) underestimated the precision of these estimates. Therefore, the bootstrapped average marginal effects (AMEs) from the village-clustered specification form the definitive basis for our conclusions.
| Variable | Mean | Median | Standard deviation | Minimum | Maximum | Valid |
|---|---|---|---|---|---|---|
| Hhsize | 9.21 | 8.00 | 7.11 | 1 | 31 | 298 |
| Age | 35.4 | 30.0 | 15.8 | 17 | 95 | 298 |
| Gender | 0 | 1 | 298 | |||
| Marital_status | 1 | 3 | 298 | |||
| Land_ownership | 0 | 1 | 298 | |||
| Education_leve | 1 | 3 | 298 | |||
| MM_Use | 0 | 1 | 298 | |||
| Family_Income | 191,716 | 50,000 | 577,757 | 2,000 | 7200,000 | 298 |
| HFIAS_Score | 12.37 | 10.00 | 6.220 | 6 | 25 | 298 |
| Variable | Estimate | Robust standard error | Average marginal effect | z-value | p-value | ||||||||||||||
|---|---|---|---|---|---|---|---|---|---|---|---|---|---|---|---|---|---|---|---|
| Intercept | 51.30 | 7.69 | 0.00*** | ||||||||||||||||
| Age (cont) | -0.02 | 0.03 | -0.023 | -0.640 | 0.52 | ||||||||||||||
| Gender (Male) | -0.36 | 0.73 | -0.063 | -0.490 | 0.62 | ||||||||||||||
| Marital Status (Single/) | -1.21 | 0.92 | -1.101 | -1.320 | 0.19 | ||||||||||||||
| Marital Status (Widow/Widower) | -0.41 | 2.25 | 0.918 | -0.180 | 0.86 | ||||||||||||||
| Land Ownership (Yes) | -2.81 | 0.76 | -1.888 | -3.700 | 0.00*** | ||||||||||||||
| MM Use (Yes) | -15.43 | 8.73 | -4.280 | -1.770 | 0.08* | ||||||||||||||
| Log of Family Income | -2.99 | 0.78 | -1.745 | -3.850 | 0.00*** | ||||||||||||||
| Education Level (Secondary) | -2.73 | 0.89 | -2.034 | -3.040 | 0.00*** | ||||||||||||||
| Education Level (University) | -3.11 | 0.84 | -2.449 | -3.710 | 0.00*** | ||||||||||||||
| MM × Log Income | 1.07 | 0.85 | 1.070 | 1.250 | 0.21 | ||||||||||||||
| log (Sigma) | 1.734 | 0.05 | |||||||||||||||||
| Note: The Tobit model fit the data well (log-likelihood = -771.6, Wald χ²(10) = 298.2, p < 0.001). The model converged after 5 iterations. *** p < 0.01; **p < 0.05; *p < 0.1. | |||||||||||||||||||
Recognising that households within the same village share unobserved characteristics, we accounted for this clustering to obtain robust standard errors. The results from this preferred specification are presented as AMEs in Tables 10 and 11, derived from the village-clustered model using bootstrapped standard errors (500 replications) to ensure robust inference. These AMEs represent the average expected change in the observed HFIAS score for a unit change in each predictor, holding all other variables constant.
MM use is a potent driver of food security. The AME indicates that, on average, the HFIAS score of MM users is 6.08 points lower (95% CI -8.61, -3.55) than non-users, a highly significant effect (*p* < 0.001). This represents a shift of nearly one full category on the HFIAS severity scale (e.g., from severe to moderate food insecurity).
| Variable | Main model | No education | No main income | Village fixed effects | |||||||||||||||
|---|---|---|---|---|---|---|---|---|---|---|---|---|---|---|---|---|---|---|---|
| Mobile money user | -17.810*** (5.385) | -18.608*** (5.505) | -17.810*** (5.385) | -17.807** (6.915) | |||||||||||||||
| Mobile money × log income | 1.065* (0.614) | 1.125* (0.632) | 1.065* (0.614) | 1.018 (0.749) | |||||||||||||||
| Log family income | -2.628*** (0.545) | -2.752*** (0.521) | -2.634*** (0.578) | – | |||||||||||||||
| Secondary education | -1.224* (0.670) | – | -1.224* (0.670) | -1.086 (0.717) | |||||||||||||||
| University education | -1.675*** (0.405) | – | -1.675*** (0.405) | -1.341*** (0.459) | |||||||||||||||
| Age | -0.019 (0.018) | -0.007 (0.021) | -0.019 (0.018) | -0.007 (0.015) | |||||||||||||||
| Male head of household | 0.546 (0.854) | 0.537 (0.882) | 0.546 (0.854) | 0.555 (0.915) | |||||||||||||||
| Single | -0.715 (0.677) | -0.778* (0.446) | -0.715 (0.677) | -0.162 (0.966) | |||||||||||||||
| Widow/widower | 3.131 (2.053) | 3.320* (1.890) | 3.131 (2.053) | 1.509 (1.997) | |||||||||||||||
| Farmland owner | -1.934 (1.676) | -1.925 (1.671) | -1.934 (1.676) | -1.354 (1.643) | |||||||||||||||
| Katibougou (village) | – | – | – | -0.128 (0.088) | |||||||||||||||
| Mamibougou (village) | – | – | – | 2.623*** (0.218) | |||||||||||||||
| Constant | 47.305*** (4.687) | 47.319*** (4.337) | 47.305*** (4.687) | 45.966*** (4.798) | |||||||||||||||
| Village clustering | Yes | Yes | Yes | Yes | |||||||||||||||
| Village fixed effects | No | No | No | Yes | |||||||||||||||
| Observations | 298 | 298 | 298 | 298 | |||||||||||||||
| Log-likelihood | -771.626 | -774.137 | -771.626 | -763.096 | |||||||||||||||
| Note: Standard errors clustered at the village level are presented in parentheses. ***p < 0.01; **p < 0.05; *p < 0.1. | |||||||||||||||||||
| Variable | Average marginal effect | Standard error | 95% confidence interval | p-value | |||||||||||||||
|---|---|---|---|---|---|---|---|---|---|---|---|---|---|---|---|---|---|---|---|
| Mobile money user | -6.08 | 1.29 | [-8.61, -3.55] | < 0.001*** | |||||||||||||||
| Log family income | -1.84 | 0.36 | [-2.54, -1.14] | < 0.001*** | |||||||||||||||
| Age | -0.02 | 0.03 | [-0.07, 0.03] | 0.478 | |||||||||||||||
| Male head of household | 0.55 | 0.69 | [-0.80, 1.89] | 0.426 | |||||||||||||||
| Single | -0.72 | 0.79 | [-2.26, 0.83] | 0.365 | |||||||||||||||
| Widow/widower | 3.13 | 1.95 | [-0.68, 6.95] | 0.108 | |||||||||||||||
| Farmland owner | -1.93 | 0.66 | [-3.22, -0.64] | 0.003*** | |||||||||||||||
| Secondary education | -1.22 | 0.83 | [-2.85, 0.40] | 0.140 | |||||||||||||||
| University education | -1.67 | 0.83 | [-3.30, -0.05] | 0.044* | |||||||||||||||
| Note: Marginal effects were computed from the Tobit estimates. Bootstrapped standard errors (500 replications) were calculated to ensure robust inference given the relatively small sample size. ***p < 0.01; **p < 0.05; *p < 0.1. | |||||||||||||||||||
Household income is another critical factor. A 1% increase in family income is associated with a 1.84 unit decrease in the HFIAS score (95% CI -2.54, -1.14; *p* < 0.001). The education level also confers a significant protective effect. Attaining a university education is associated with a 1.67-point reduction in food insecurity (95% CI -3.30, -0.05; *p* < 0.05), while the effect of secondary education, though negative, is not statistically significant (AME = -1.22, *p* = 0.140). Land ownership remains an important asset, associated with a 1.93-point improvement in food security (95% CI -3.22, -0.64; *p* < 0.01).
A key finding from the interaction coefficient is that the beneficial effect of MM is moderately stronger for households with lower incomes (MM × log income coefficient = 1.065, *p* < 0.1). This suggests digital financial services play a crucial role in enhancing resilience specifically for the most economically vulnerable.
Conversely, the AMEs for demographic factors such as age, gender, and marital status are not statistically significant, with CIs straddling zero. This likely reflects the strength of communal support systems and collective household strategies that mitigate individual-level vulnerabilities in this context.
The findings from this study reveal significant diversity in food security outcomes across geographical locations, demographic groups, and socio-economic characteristics, with MM usage emerging as a particularly significant determinant of food security. We found that MM usage has a robust and statistically significant relationship with food security based on several analyses. The preferred Tobit model, accounting for village-level clustering, revealed a strong negative association between MM usage and food insecurity (AME = -6.08, 95% CI -8.61, -3.55, *p* < 0.001). This relationship is corroborated by the descriptive statistics: 141 MM users were food secure compared with only 15 who were severely food insecure. In contrast, 40 non-users reported severe food insecurity. This suggests that MM plays a critical role in enhancing household resilience by facilitating timely financial transactions, reducing transaction costs, and enabling access to remittances and savings. The strength of this effect may be amplified by Mali’s unique MM ecosystem, where services such as Orange Money and Wave dominate rural areas with extensive agent networks, bridging gaps left by scarce traditional banking infrastructure. Our findings align with the study by Murendo, Wollni (2016), who showed that MM adoption significantly affects food security in Uganda. Our analysis also revealed that households that perceived a strong effect of MM on food security showed a clear improvement in food security outcomes. On the other hand, households that perceived no effect of MM on food security experienced the highest rates of severe food insecurity. The ‘yes effect’ group, which included households acknowledging the positive influence of MM, reported fewer severe cases compared with the ‘no effect’ group, highlighting the importance of both actual and perceived financial inclusion in driving behaviour and access to resources.
Contrary to the findings of some studies (e.g., Atta-Aidoo et al., 2024; Aliyu et al., 2022), we did not find a significant independent association between gender or marital status and food security outcomes in our robust model (the 95% CIs for the AMEs included zero), despite some apparent differences in the descriptive data. This suggests that, in this specific context, the potential effects of these demographic factors may be mitigated by other variables in the model, such as income, land ownership, and MM use. The lack of a significant gender effect could be attributed to the strong communal and kinship support systems noted earlier, where food provisioning responsibilities are often shared regardless of the gender of the head of household (Allotey et al., 2022). Similarly, the nonsignificant effect of marital status may reflect the social safety nets that absorb widowed or unmarried individuals into broader family units, reducing their economic vulnerability (Diamoutene, Jatoe, 2024). This shows the critical role of the local cultural context in shaping food security determinants, suggesting that the disparities observed in other regions may not be as prevalent in the studied communities of Mali due to these protective social structures.
Our findings highlighted that owning land is an important factor in food security (AME = -1.93, 95% CI -3.22, -0.64, *p* < 0.01). Households without land were more likely to experience food insecurity compared with landowners. The positive correlation between land ownership and food security has been well documented in the literature. For example, the ownership of land has consistently been shown to correlate with improved food security outcomes, as land ownership enables more reliable agricultural production and income generation (Sidibé et al., 2018). Owning land is a critical factor in ensuring access to food in rural areas because it affects household nutrition and food security. Research conducted in India (Goli et al., 2021; Pritchard et al., 2017) and Nicaragua (Schmook et al., 2021) has demonstrated the significant impact of agricultural landholding on food insecurity levels, with households that own land having better access to essential food items. Furthermore, the connection between smallholder food insecurity and land access and tenure reveals the persistent issue of hunger among rural populations, regardless of political alignments or land tenure arrangements. The importance of land ownership is emphasised because secure access to land can enhance welfare; income; and investment in food, health, and education, ultimately contributing to reduce poverty and to spur economic development.
We found that the education level, particularly a university education, significantly improves food access (AME = -1.67, 95% CI -3.30, -0.05, *p* < 0.05). The respondents with a university education had higher food security outcomes, likely due to better access to formal employment, information on nutrition and health, and financial literacy. The results of this study are similar to the findings of Ishfaqet al. (2022) in Pakistan: the education level positively affects the food security status. The higher the education of the family head, the better the household food security will be.
From an occupational viewpoint, households classified under ‘others’ and those involved in trade showed higher food security, whereas farmers were distributed across all food security categories, including severe insecurity. According to Atta-Aidoo et al. (2024), households with diverse occupations other than farming are not exposed to the seasonal fluctuations associated with agriculture and on-farm income. Such households are therefore able to secure adequate food throughout the year with little or no difficulty. The findings of this study are in line with that of Dzanku (2019) and Regmi, Paudel (2016), who indicated that off-farm income has a positive correlation with household food security.
The comparison between MM and cash revealed that households attributing stronger effects to MM over physical cash were significantly more likely to be food secure, highlighting the potential of digital finance as a major instrument for promoting rural food resilience. This result is consistent with the findings of Munyegera, Matsumoto (2016) and Yao et al. (2023), who showed that households that adopt MM have an advantage compared with non-adopters, mostly in terms of remittances, which gives them the capacity to withstand food security during shocks.
According to the findings of the study, family income positively increases the probability of a household to be food secure. The Kruskal-Wallis test results support the importance of income in determining food security. We observed statistically significant differences across all but one category comparison (i.e., mild vs moderate food insecurity). Food secure households had higher income than all other categories. Consistently, Achilana et al. (2020) and Abdallahh et al. (2024) have shown that lower-income households struggle to afford healthy foods, which affects their food security status.
5. Conclusion and recommendations
This study has revealed the vital role of MM in enhancing food accessibility and affordability in rural Mali, where digital remittances and land ownership emerge as key determinants of household resilience. By facilitating timely income streams, reducing transaction costs, and bridging gaps in formal financial access, particularly in underserved regions such as Koulikoro, MM services such as Orange Money have demonstrated measurable impacts on food security. Our findings from Koulikoro are scalable and can be replicated in the larger Malian context, including areas plagued with conflicts and climate stress. Moreover, the full potential of these tools cannot be fully exploited without addressing systemic barriers, from gender-based resource disparities to land tenure insecurity and climate vulnerabilities.
Based on our findings, we propose several recommendations to policymakers and stakeholders aiming to enhance food access and reduce food insecurity in rural areas. We recommend policies that promote income generation and secure property rights.
Mali, like many rural regions in sub-Saharan Africa, has seen growth in mobile phone usage and MM services, particularly in urban areas. However, many rural households still lack consistent access to income opportunities. Expanding digital remittance platforms can help connect migrant workers with their families in rural Mali, providing them with a frequent income that can be used for food, health, and education. This would be particularly beneficial given the high reliance on remittances in rural areas.
Access to financial services in rural Mali is limited, particularly for women and smallholder farmers. Expanding financial services, such as microcredit, savings groups, and insurance, would give Malian households the tools to invest in agricultural improvements and to manage financial risks. This is crucial in a country where many are vulnerable to environmental and economic shocks. Improving financial inclusion could lead to greater stability and security for households, enhancing their ability to access food.
Gender inequality in Mali is a significant issue, with women often having limited access to resources such as land, credit, and education. By adopting gender-transformative policies in agriculture, Mali could address this imbalance. Empowering women with equal access to agricultural resources would not only enhance their productivity but also improve household food security. Ensuring women’s participation in decision-making processes related to agriculture and food systems could result in more sustainable and inclusive food security outcomes.
In Mali, land tenure insecurity is a key factor limiting agricultural investment and productivity. Smallholder farmers, particularly in rural areas, face difficulties in securing land rights due to historic and legal challenges. Reforming land tenure systems to provide clearer, more secure land rights would encourage farmers to invest in long-term agricultural improvements, leading to increased productivity and food availability. Secure land tenure could also reduce land conflicts, particularly in areas affected by displacement due to conflict.
Malian farmers face challenges from climate change, drought, and soil degradation. Diversifying agricultural practices and promoting innovations such as drought-resistant crops, improved irrigation, and climate-smart agriculture could help buffer against these challenges. Policies that support agricultural diversification can also reduce the dependency on a single crop (e.g., millet or cotton) and improve household income stability, leading to better food access and improved resilience to shocks. Traditional markets are often disrupted in certain parts of Mali due to insecurity, leading to higher food prices and reduced access to essential goods. Strengthening local markets and supply chains, especially in rural areas, could help reduce the reliance on external food sources and ensure that food is more readily available. By improving rural infrastructure and market access, local food systems can be made more resilient to external shocks, like conflicts or price volatility.
To build upon this work, future research should move beyond observational data to establish causal evidence, perhaps through experimental designs such as a randomised rollout of MM services. This would allow for a clearer understanding of its true impact. Furthermore, it is critical to investigate not just if MM works, but for whom and under what conditions. This endeavour entails an examination of how its benefits are distributed across different segments of society, particularly along the lines of gender, age, and vulnerability, to ensure that it does not inadvertently widen existing inequalities. The local ecosystem is also paramount; studies should explore how the effects of MM are amplified or constrained by factors like network coverage, agent density, and access to markets. Finally, given the increasing pressures of climate change, a vital avenue for research is to determine whether MM can serve as a real-time financial cushion against shocks such as droughts, and how it can be most effectively integrated with broader support systems, such as agricultural extension programmes or social protection schemes, to create a more resilient food security framework for the future.
OAO.: Writing, Conceptualization, Methodology, Statistical analysis. P.S.: Data curation, Writing- Original draft preparation. TD: Data collection, Editing, and Proof reading. NLN: Writing, Proof reading, conceptualization. ID: Data cleaning, and Statistical analysis.
Abdallah W., Harraf A., Ghura H., Abrar M. (2025). Financial literacy and small and medium enterprises performance: the moderating role of financial access. Journal of Financial Reporting and Accounting, 23(4): 1345-1364. DOI: https://doi.org/10.1108/JFRA-06-2024-0337.
Achilana M., O’Connor D., Mkamwa T.F. (2020). Low income farm households’ access to markets and household food security: The case of two economically distinct areas in rural Tanzania. African Journal of Food, Agriculture, Nutrition and Development, 20(3): 15876-15897. DOI: https://doi.org/10.18697/ajfand.91.18095.
Aliyu M.K., Ibrahim A.L., Garuba H.S., Umar A.M., Muhammad K., Lawal A., Qasim O.H. (2022). Gender accessibility to agricultural production resources amongst rural farmers in the north-eastern Nigeria. Journal of Agricultural Extension, 26(2): 108-119. DOI: https://doi.org/10.4314/jae.v26i1.14S.
Allotey D., Flax V.L., Ipadeola A., Kwasu S., Bentley M.E., Worku B., Kalluru K., Valle C.G., Bose S., Martin S.L. (2022). Maternal and paternal involvement in complementary feeding in Kaduna State, Nigeria: the continuum of gender roles in urban and rural settings. Maternal & Child Nutrition, 18(2), e13325. DOI: https://doi.org/10.1111/mcn.13325.
Aron J. (2018). Mobile money and the economy: a review of the evidence. The World Bank Research Observer, 33(2): 135-176. DOI: https://doi.org/10.1093/wbro/lky001.
Arshad A. (2022). Impact of financial inclusion on food security: evidence from developing countries. International Journal of Social Economics, 49(3): 336-355. DOI: https://doi.org/10.1108/IJSE-08-2021-0462.
Atta-Aidoo J., Bizoza S., Matthew E.C., Saleh A.O. (2024). Mobile money, food security and coping strategies in a post-conflict and fragile context: evidence from Burundi. Journal of Economics and Development, 26(4): 306-328. DOI: https://doi.org/10.1108/JED-10-2023-0185.
Bruhn M. (2019). The impact of mobile money on poor rural households, VoxDev. https://voxdev.org/topic/finance/impact-mobile-money-poor-rural-households-evidence-uganda.
David-West O., Iheanachor N., Umukoro I.O. (2019). MM as a frugal innovation for the bottom of the pyramid – cases of selected African countries. Africa Journal of Management, 5(3): 274-302. DOI: https://doi.org/10.1080/23322373.2019.1652023.
Diallo S.A., Savadogo K., Tiemtore A., Diarra S., Kouyate D., Sangare, B.M. (2021). Determinants of food insecurity in rural areas in Mali. Asian Journal of Agricultural Extension, Economics & Sociology, 39(3): 158-172. DOI: https://doi.org/10.9734/AJAEES/2021/V39I330556.
Diamoutene A.K., Jatoe J.B.D. (2024). Participation in social safety net programs and household agricultural performance in Mali. Journal of Social and Economic Development. DOI: https://doi.org/10.1007/s40847-024-00394-w.
Dunne J.P., Kasekende E. (2017). Mobile money and household consumption patterns in Uganda, Research Papers in Economics. http://hdl.handle.net/11090/886.
Dzanku F.M. (2019). Food security in rural sub-Saharan Africa: exploring the nexus between gender, geography and off-farm employment. World Development, 113: 26-43. DOI: https://doi.org/10.1016/j.worlddev.2018.08.017.
FAO (2007). Household Food Insecurity Access Scale (HFIAS) for Measurement of Food Access: Indicator Guide. VERSION 3. Written by Jennifer Coates, Anne Swindale, Paula Bilinsky.
Guérin I., Isaurralde M., Sangaré M. (2018). Faire du business pour le social ou grâce au social: l’exemple de l’inclusion financière. Marché et organisations, 31(1): 103-123. DOI: https://doi.org/10.3917/maorg.031.0103.
Goli S., Rammohan A., Reddy S.P. (2021). The interaction of household agricultural landholding and caste on food security in rural Uttar Pradesh, India. Food Security, 13(1): 219-237. DOI: https://doi.org/10.1007/s12571-020-01109-9.
Greene W.H. (1993). Econometric Analysis (2nd ed.). Macmillan, New York, NY, USA.
Ishfaq S., Anjum A., Kouser S., Nightingale G., Jepson R. (2022). The relationship between women’s empowerment and household food and nutrition security in Pakistan. PloS one, 17(10), e0275713. DOI: https://doi.org/10.1371/journal.pone.0275713.
Harkness J.A., Braun M., Edwards B., Johnson T.P., Lyberg L.E., Mohler P.P., Pennell B.E., Smith T.W. (eds.) (2010). Survey methods in multinational, multiregional, and multicultural contexts. John Wiley & Sons. DOI: https://doi.org/10.1002/9780470609927.
Huang S., Nik Azman N.H. (2023). Enhancing food security through digital inclusive finance: Evidence from agricultural enterprises in China. International journal of environmental research and public health, 20(4), 2956. DOI: https://doi.org/10.3390/ijerph20042956.
Kabbiri R., Dora M., Kumar V., Elepu G., Gellynck X. (2018). Mobile phone adoption in agri-food sector: Are farmers in Sub-Saharan Africa connected?. Technological Forecasting and Social Change, 131: 253-261. DOI: https://doi.org/10.1016/j.techfore.2017.12.010.
Menekse G. (2011). Mobile money: a foundation for food security. Innovations: Technology, Governance, Globalization, 6(4): 73-79. DOI: https://doi.org/10.1162/INOV_A_00102.
Morduch J. (1999). The microfinance promise. Journal of Economic Literature, 37(4): 1569-1614. DOI: https://doi.org/10.1257/jel.37.4.1569.
Munyegera G.K., Matsumoto T. (2016). Mobile money, remittances, and household welfare: Panel evidence from rural Uganda. World Development, 79: 127-137. DOI: https://doi.org/10.1016/j.worlddev.2015.11.006.
Murendo C., Wollni M. (2016). Mobile money and household food security in Uganda, Paper No. 76, GlobalFood. DOI: https://doi.org/10.22004/AG.ECON.229805.
Naito H., Ismailov A., Kimaro A. B. (2021). The effect of mobile money on borrowing and saving: Evidence from Tanzania. World Development Perspectives, 23, 100342. DOI: https://doi.org/10.1016/j.wdp.2021.100342.
Newbold P. (1995). Statistics for Business and Economics. Prentice-Hall, Hoboken, NJ, USA.
O’Hara S., Toussaint E.C. (2021). Food access in crisis: food security and COVID-19. Ecological Economics, 180, 106859. DOI: https://doi.org/10.1016/j.ecolecon.2020.106859.
Piaskoski A., Reilly K., Gilliland J. (2020). Conceptual model of rural household food insecurity: a qualitative systematic review and content analysis. Family & Community Health, 43(4): 296-312. DOI: https://doi.org/ 10.1097/FCH.0000000000000273.
Pritchard B., Rammohan A., Sekher M. (2017). Land ownership, agriculture, and household nutrition: A case study of North Indian villages. Geographical Research, 55(2): 180-191. DOI: https://doi.org/10.1111/1745-5871.12199.
Regmi M., Paudel K.P. (2016). Impact of remittance on food security in Bangladesh. In Mishra A.K. (eds), Food Security in a Food Abundant World. Emerald Group Publishing, Leeds. Page Range1 – 16.
Rural Health Information Hub (2023). Rural hunger and access to healthy food overview. https://www.ruralhealthinfo.org/topics/food-and-hunger.
Sassi M., Sassi A., Acocella. (2018). Understanding food insecurity. Cham: Springer.
Schmook B., Carte L., Radel C., Olmedo S.N. (2020). Links between land access, land use, and hunger in today’s neoliberal Nicaragua. In McDonald B., McCarthy T. (eds), Food Insecurity (pp. 96-112). Routledge, London.
Sen A. (1999). Commodities and Capabilities. Oxford University Press, Oxford.
Sidibé A., Totin E., Thompson-Hall M., Traoré O.T., Traoré P.C.S., Olabisi L.S. (2018). Multi-scale governance in agriculture systems: Interplay between national and local institutions around the production dimension of food security in Mali. NJAS-Wageningen Journal of Life Sciences, 84: 94-102. DOI: https://doi.org/10.1016/j.njas.2017.09.001.
Wantchekon L., Riaz Z. (2019). Mobile technology and food access. World Development, 117: 105-118. DOI: https://doi.org/10.1016/j.worlddev.2019.01.006.
Wieser C., Bruhn M., Kinzinger J.P., Ruckteschler C.S., Heitmann S. (2019). The impact of mobile money on poor rural households: Experimental evidence from Uganda. World Bank Policy Research Working Paper, (8913).
United Nations (2021). World Population Prospects 2022. In Statistical Papers - United Nations (Ser. A), Population and Vital Statistics Report. United Nations, New York, NY, USA. https://www.un-ilibrary.org/content/books/9789210014380.
Yao B.H., Shanoyan A., Schwab B., Amanor-Boadu V. (2022). Mobile money, transaction costs, and market participation: Evidence from Côte d’Ivoire and Tanzania. Food Policy, 112, 102370. DOI: https://doi.org/10.1016/j.foodpol.2022.102370.
Yao B., Shanoyan A., Schwab B., Amanor-Boadu V. (2023). The role of mobile money in household resilience: Evidence from Kenya. World Development, 165, 106198. DOI: https://doi.org/10.1016/j.worlddev.2023.106198.
Zenk S.N., Tabak L.A., Pérez-Stable E.J. (2022). Research opportunities to address nutrition insecurity and disparities. JAMA, 327(2): 1953-1954. DOI: https://doi.org/10.1001/jama.2022.7159.