https://doi.org/10.36253/ijae-15806
Effect of streptozocin-induced diabetes on the histomorphometry of the liver and kidneys of male sprague dawley rats
1 Department of Anatomy, School of Medicine, Sefako Makgatho Health Sciences University, Ga-Rankuwa, Pretoria, South Africa
2 Department of Physiology and Environmental Health, University of Limpopo, Sovenga, 0727, South Africa
*Corresponding author. E-mail: mbelengwapfarelo@gmail.com
Abstract. The liver and kidneys are among primary organs affected by Diabetes mellitus (DM), whereas chronic antidiabetic medication has side effects on these organs. Due to the said side effects, there is an increase in research for new natural based antidiabetic medication making use of streptozocin (STZ) induced diabetic rodent model. However, dosage and duration of STZ in diabetes induction vary with potential inconsistencies in interpretation of the results by different authors. We investigated the effects of a single dose, (50mg/kg) of STZ on the histomorphometry of liver and kidneys of male Sprague Dawley rats after 21 days of diabetes induction. Hepatocyte (HA), nuclear and cytoplasmic (CA) areas were measured in zones 1 and 3 of the liver tissues from 16 [8 Normal C, 8 STZ diabetic DM] male Sprague Dawley rats. Corpuscular, renal, glomerular tuft, tubular, epithelial, luminal areas and connective tissue were also measured in kidney tubules from the same animals using a hand tool of ImageJ software. Means were compared using a student’s t-test in SPSS software. HA in zone1 of DM was significantly higher than that of the C (p=0.009), while HA in zone 3 of DM were significantly lower than in C (p=0.032). The CA in zone1 of DM was significantly higher than that of C (p=0.006). A significant change was only fibrosis of the glomerular tuft in kidneys. 50mg/kg STZ induced diabetes caused some changes in the liver and kidney tissues but not a full pathologic profile as seen in studies with a longer duration.
Keywords: diabetes mellitus, diabetic nephropathy, kidneys, liver, steatohepatitis.
Contents
Histomorphometric measurements
Induction of diabetes, weights and glucose level changes
Morphological changes in the liver and kidney tissues
Introduction
Diabetes mellitus (DM) is a metabolic condition defined by hyperglycemia resultant from lack of insulin secretion and activity. Hyperglycemia is related to organ damage and dysfunction specifically affecting the liver and kidneys, resulting in steatosis, steatohepatitis and glucosuria among other things (Guilnerme et al., 2019). As per the report by the World Health Organization (WHO), a person dies from diabetes every seven seconds, with over 4 million of these fatalities occurring in adults under 60 years (WHO, 2022). In the year 2021, diabetes statistics estimated that DM affected 536.6 million people among individuals ranging from 20 to 79 years old in 215 countries with an estimation of 783.2 million for the year 2045. It has been predicted that the total number of diabetic patients would increase by 46% in the year 2045 due to population growth in the middle income countries (Sun et al., 2022).
The liver is one of the main organs that are vulnerable to oxidative stress caused by high blood glucose levels, causing harm such as steatosis in the liver tissue (Mohamed et al., 2016). Diabetes can also cause non-alcoholic fatty liver disease (NAFLD) (Calzadilla, Bertot and Adams, 2016). Besides liver injury, DM complications include diabetic nephropathy characterised by glomerular basement membrane thickness, mesangial cell growth, and nephron ischemia in addition to liver injury (Tang, 2018).
The commonly used antidiabetic medication includes metformin and insulin injection (Hossain and Pervin, 2018). However, due to side effects and cost of the currently available antidiabetic medication, some populations resort to herbal medication believed to have antidiabetic properties (Abd Rashed and Rathi, 2021). Streptozocin (STZ)-induced diabetic rodent experimental model is commonly used in antidiabetic drug testing, however, experimental design such as the dosage of STZ and the length of time animals are observed after induction of diabetes are highly variable amongst different authors (Norgaard et al., 2020). The dosage of STZ used to induce diabetes in rats ranges from 20 mg/kg to 80 mg/kg with differing durations animals are kept after induction of diabetes in across different studies (Naseri et al., 2022). Whether the varying dosages and differences in time the diabetic animals are kept after induction of diabetes possess the same effects on organs, particularly liver and kidneys, has not been fully investigated. The dosage of 50mg/kg STS and duration of 21 days of observation of animals is common in studies looking at physiological parameters. Whether this dosage and duration induces histological changes is of scientific importance for the studies that might be interested in organ or tissue changes. The current study investigated the effects of a 50 mg/kg STZ induced diabetes over a period of 21 days in the kidneys and livers of the male Sprague Dawley rats.
Materials and methods
Animals
Sixteen adult male Sprague Dawley rats (three months old) weighing 220–350 g, purchased from Northwest University in South Africa were used in this study. Live animals were housed in the animal unit of Sefako Makgatho Health Sciences University’s Department of Physiology. Each animal was housed in a cage in a temperature-controlled room on a 12-hour light/12-hour dark cycle, with unlimited supply of water and rat chow in accordance with the animal ethics prescriptions. Ethics approval with the ethics number (SMUREC/M/127/2022) was obtained from the animal ethics committee of Sefako Makgatho Health Sciences University which complies with the National Institute of Health (NIH) for Care and Use of Laboratory Animals in scientific experimentation.
Induction of diabetes
After a week of acclimation, the animals were fasted for 18 hours before receiving an intraperitoneal injection of freshly prepared pancreatic-cell toxin streptozocin (STZ) 1ml/kg dissolved in 0.1M sodium citrate buffer (pH 4.5) at a dose of 50 mg/kg bodyweight. Animals were then given a 5% glucose solution in their drinking water over night to prevent hypoglycemia. Blood from the tail vein was used to measure blood glucose levels after 72 hours. Fasting blood glucose levels of above 10.0 mM confirmed hyperglycemia. Bodyweights were measured daily, and blood glucose levels were measured on day 3, 7, 14 and 21 post induction of diabetes.
Experimental design
Animals were randomly assigned to one of two experimental groups: Group 1 (n=8) were normal (Control) rats, Group 2 (n=8) were STZ (50mg/kg) induced diabetic rats, all with unlimited supply of food and water. After induction of diabetes, the animals were kept for 21 days with no intervention. At the end of the 21-day period (day 22), the animals were anesthetized with an intraperitoneal injection of a mixture (1.4 ml/kg.bw) of Anaket V (Ketamine) 40-80mg/kg and Rompun 2% (Xylazine) 5-10mg/kg, after which the liver and kidney tissues were collected and preserved in 10% buffered formalin prior to processing for histological sectioning and staining.
Histological procedure
The automatic tissue processor was utilized to process liver and kidney tissues, followed by paraffin embedding. Processed and paraffin embedded liver and kidney tissues were sectioned at 5 µm thickness using the rotary microtome and then mounted on glass slides before staining. Slide mounted liver and kidney tissues were stained with Hematoxylin and Eosin (H&E) stain for tissue architecture and Masson Trichrome (MT) stain for collagen fibre content of connective tissue using the staining protocol by Bancroft and Gamble, 2008.
Histomorphometric measurements
The photomicrographs of the H&E and MT-stained sections were taken with an Image Focus Alpha version 2.4 software connected to Image Focus light microscope (Euromex, Netherlands at 10X, 40X, and 100X). The ImageJ area tool (Schneider et al. 2012) was used to measure the hepatocyte area (HA) and nuclear area (NA) of hepatocytes (H&E at 40X magnification) in the periportal (Zone 1) and centrilobar (Zone 3) zones from slide mounted liver sections. The cytoplasmic area (CA) of each hepatocyte was calculated by subtracting the nuclear area from the total hepatocyte area, as stated by Fazelipour et al. (2008). The transitional zone, sometimes known as Zone 2, was not considered since its limits were difficult to define. A minimum of 50 hepatocytes with a nucleus and a distinct nucleolus were measured in the liver of each animal.
The ImageJ area tool was also used to measure the following parameters on kidney sections Nakayama et al. (2010): renal corpuscular area (RCA) and glomerular tuft area (GTA), proximal convoluted tubular outer area (PCT OA), proximal convoluted tubular luminal area (PCT LA), distal convoluted tubular outer area (DCT OA), and distal convoluted tubular luminal area (DCT LA). The urinary space area (USA) of each renal corpuscle was calculated by subtracting the glomerular tuft area from the renal corpuscular area. The epithelial areas of the proximal and distal convoluted tubules (PCT EA and DCT EA) were calculated by subtracting the luminal areas from the outer regions. At least 50 renal corpuscles, proximal and distal convoluted tubules were examined in each kidney, with a total of 400 measurements per treatment group.
To determine the area and area percentage of the liver occupied by collagen fibres, 50 photomicrographs per animal in each group (n = 8, i.e. 400 per group) were evaluated using the point counting method and ImageJ’s cell counter plugin, as described by Ibrahim et al. (2019). The area fraction (Afraction) occupied by connective tissue in each liver section (40X magnification) was determined using equations (1) and (2) below.
Afraction = A ÷ Acamera(1)
Where A = is the area occupied by collagen fibres, calculated using equation (2), and Acamera = area of the camera field at 40X.
A = App× ∑p. (∑p= sum of points of the grid intersecting at connective tissue)(2)
Data analysis
A students t-test statistical analyses was used to compare the means of measurements done in the liver and kidney sections in SPSS version 27. Measurements for each variable were expressed as mean± standard error. A P value of ≤ 0.05 was considered as significant difference. Shapiro Wilk test was used to test for normality. P>0.05 was considered normal distribution.
Results
Induction of diabetes, weights and glucose level changes
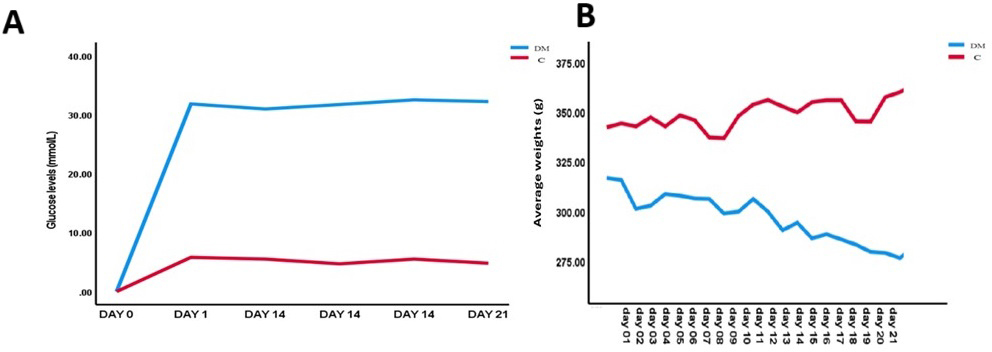
Before the induction of diabetes with STZ injection, all animals had normal blood glucose levels ranging from 4.8 to 5.8 mmol/L. After 72 hours of STZ injection, the STZ diabetic induced animals (DM) had a drastic increase of blood glucose levels to an average of 30.38 mmol/L which continued to increase over a period of 21 days to the average of 32.35 mmol/L by day 21. On the other hand, the C group maintained the normal blood glucose levels ranging from 4.8-5.8 mmol/L (Figure1A). In this experiment, animals with approximately the same body weights were used with an average weight of 316g for the DM group, and an average weight of 342g for control. The terminal weights of DM group showed a significant weight loss when compared to the initial average body weight of this group, while the control group showed a significant weight gain when compared to the initial average body weight of this group (Figure 1B). There were no statistically significant differences in the weights of liver and kidney tissues of the control and DM animals. (Table 1).
| Control | Diabetic | P value | |||||||||||||||||
|---|---|---|---|---|---|---|---|---|---|---|---|---|---|---|---|---|---|---|---|
| Weights(g) | Initial BW | 343 ± 1.41 | 316 ± 0.78 | 0.005 | |||||||||||||||
| Terminal BW | 363.75 ± 0.88 | 282.22 ± 0.3 | 0.002 | ||||||||||||||||
| Liver | 10.98 ± 0.85 | 10.24 ± 1.33 | 0.18 | ||||||||||||||||
| Kidney | 3.08 ± 0.34 | 3.27 ± 0.35 | 0.24 | ||||||||||||||||
| Glucose levels (mmol/L) | Initial | 5.1 ± 0.57 | 30.38 ± 0.81 | 0.009 | |||||||||||||||
| Terminal | 5.7±0.21 | 32.35±0.21 | 0.006 | ||||||||||||||||
| Data of all variables expressed as mean ± standard deviation. | |||||||||||||||||||
Morphological changes in the liver and kidney tissues
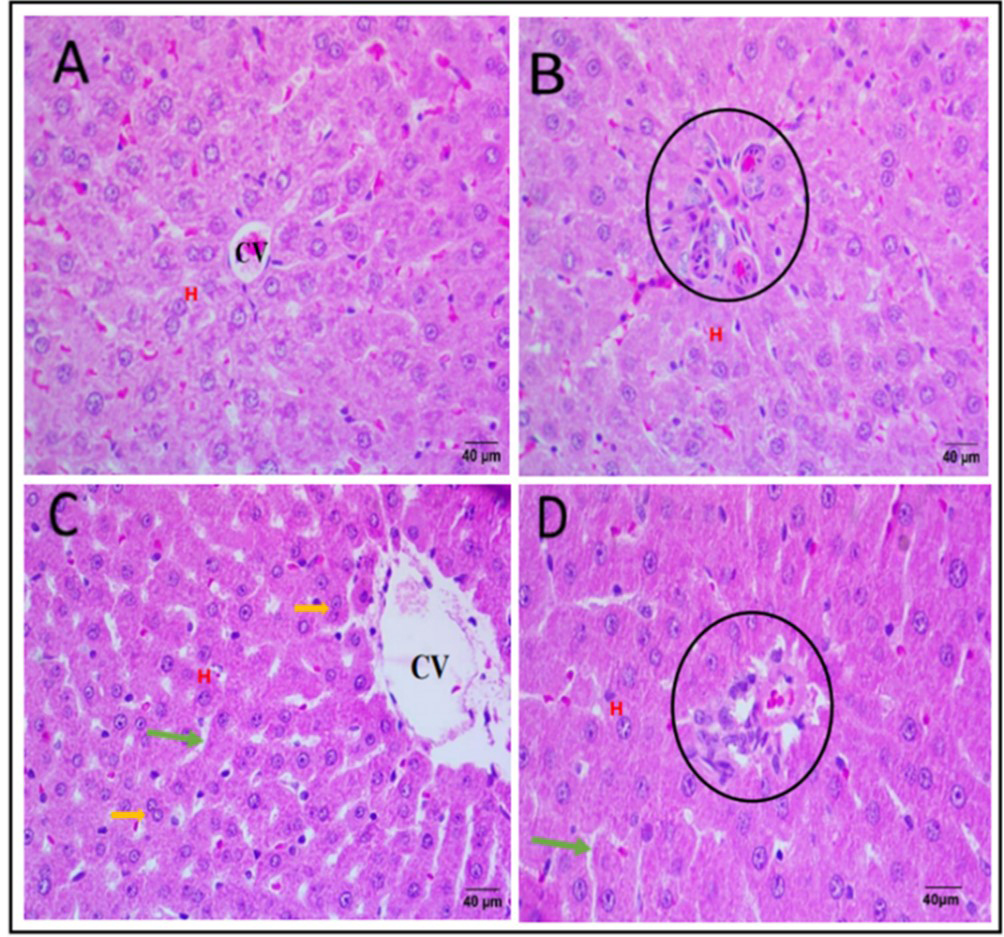
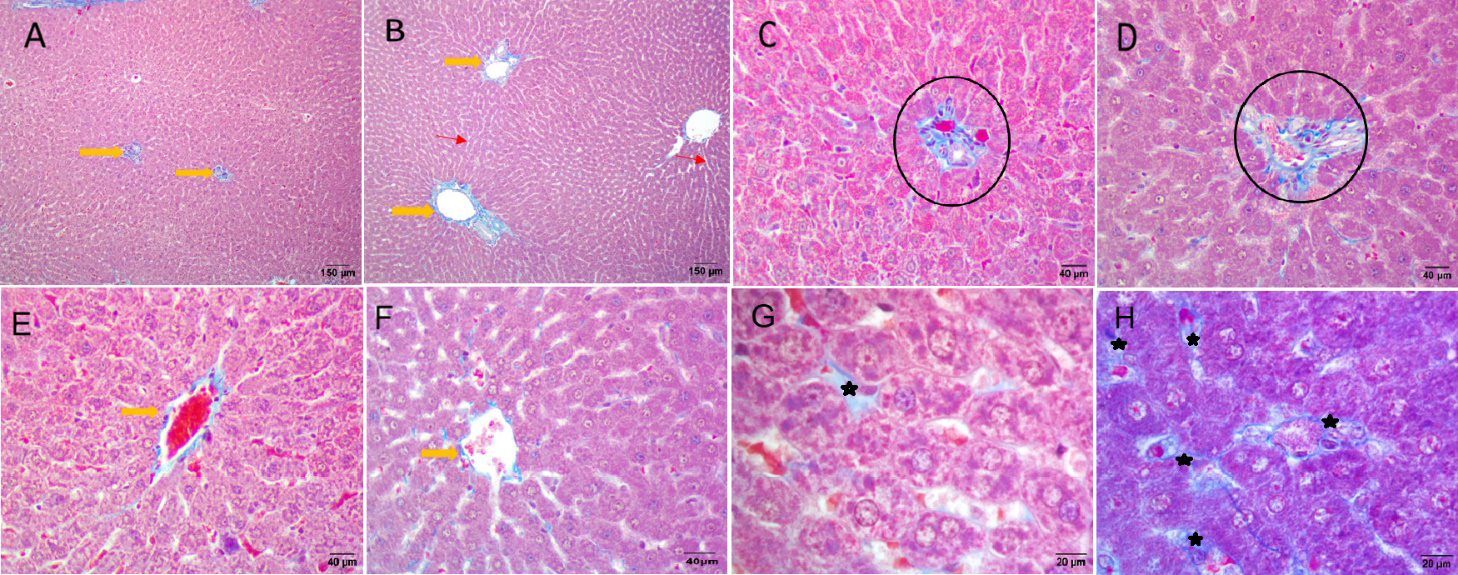
In the control group, no significant changes were seen on the structure of the hepatocytes in zones 1 and 3 of the H&E-stained liver tissues (Figure 2A-B). In zone 3 of the DM group, a number of hepatocytes with double nuclei, hepatotrophy and inflammatory infiltrates were observed (Figure 2C). Zone 1 showed widened sinusoidal spaces in some tissues of DM group (Figure 3D). In MT-stained liver sections, both control and DM groups showed moderate to no accumulation of connective tissue collagen fibers (Figure 3A-B). However, excessive accumulation of connective tissue collagen fibers was observed around the central veins (Figure 3C) and periportal areas with a few adipocyte patches.
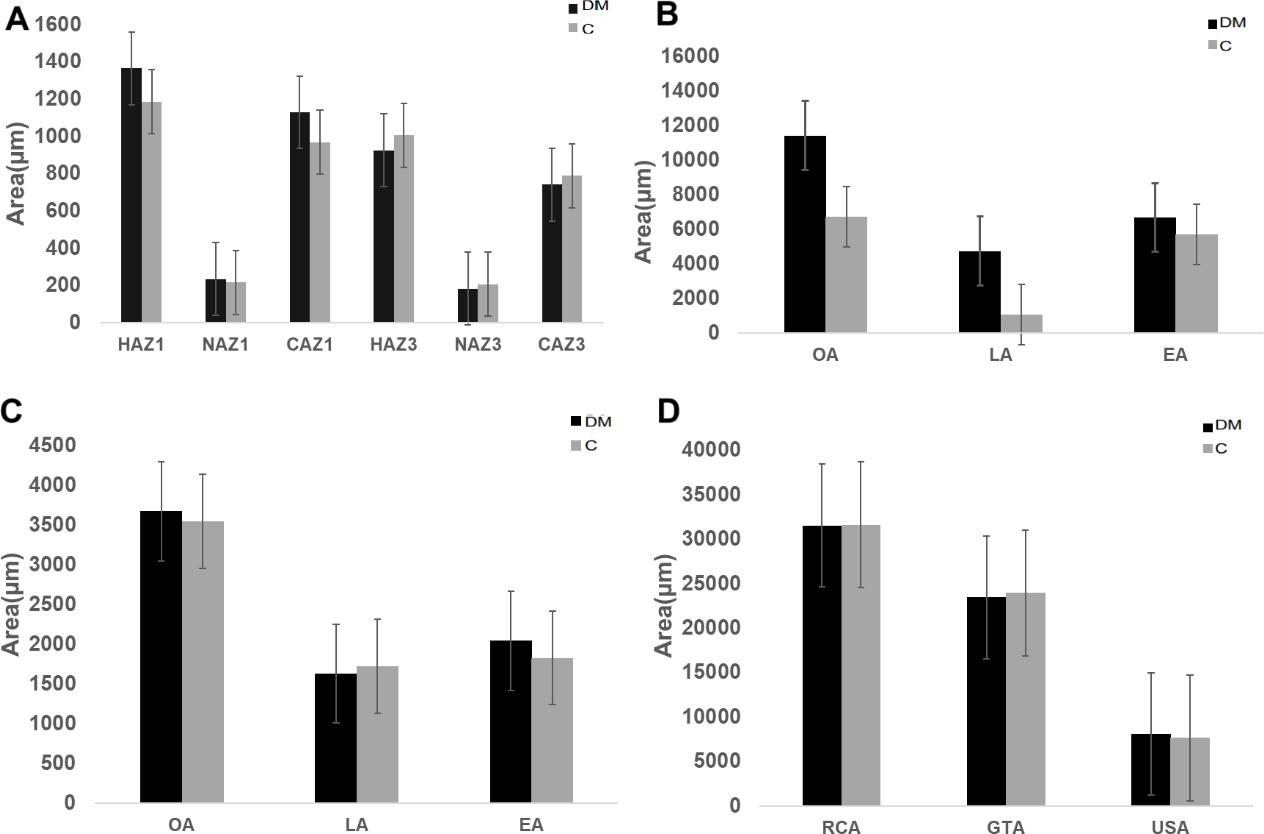
Hepatocyte area in zone 1 of the liver was significantly higher in DM animals when compared to control animals (Figure 4; Table 2). On the contrary, hepatocyte area in zone 3 was significantly lower in DM animals compared to Control animals (Figure 4; Table 2). Nuclear area in zone 3 was significantly lower in DM animals when compared to control animals (Figure 4; Table 2). The cytoplasmic area in zone 1 was significantly higher in DM than in control animals (Figure 4; Table 2). When comparing zone 1 and zone 3 of the same animal in the DM group, hepatocyte area was significantly higher in zone 1 compared to zone 3 of control group (Figure 4; Table 2). The nuclear area was significantly lower in zone 3 compared to zone 1 in the same animal in the DM group (Figure 4; Table 2). The cytoplasmic area of zone 3 showed no significant differences when comparing the DM and control groups, even though it was slightly higher in the DM group (Figure 4; Table 2). Similarly, the student t-test detected no statistically significant differences in the nuclear area of zone 1 in the DM group compared to the C group, with the DM group showing a slightly high nuclear area of this zone (Figure 5; Table 2).
| C | DM | P value | |||||||||||||||||
|---|---|---|---|---|---|---|---|---|---|---|---|---|---|---|---|---|---|---|---|
| Zone 1 | HA | 1177.41 ± 69.07 | 1365.48 ± 84.88 | 0.009 | |||||||||||||||
| NA | 218.15 ± 21.66 | 234.83 ± 13.68 | 0.098 | ||||||||||||||||
| CA | 959.64 ± 55.57 | 1129.79 ± 79.63 | 0.006 | ||||||||||||||||
| Zone 3 | HA | 1009.42 ± 94.88 | 925.80 ± 60.93 | 0.032 | |||||||||||||||
| NA | 210.10 ± 24.41 | 184.20 ± 24.27 | 0.028 | ||||||||||||||||
| CA | 799.69 ± 75.00 | 741.60 ± 40.91 | 0.061 | ||||||||||||||||
| LIVER | CT Area fraction | 0.23 ± 0.84 | 0.38 ± 0.54 | 0.004 | |||||||||||||||
| Data of all variables expressed as mean ± standard deviation. | |||||||||||||||||||
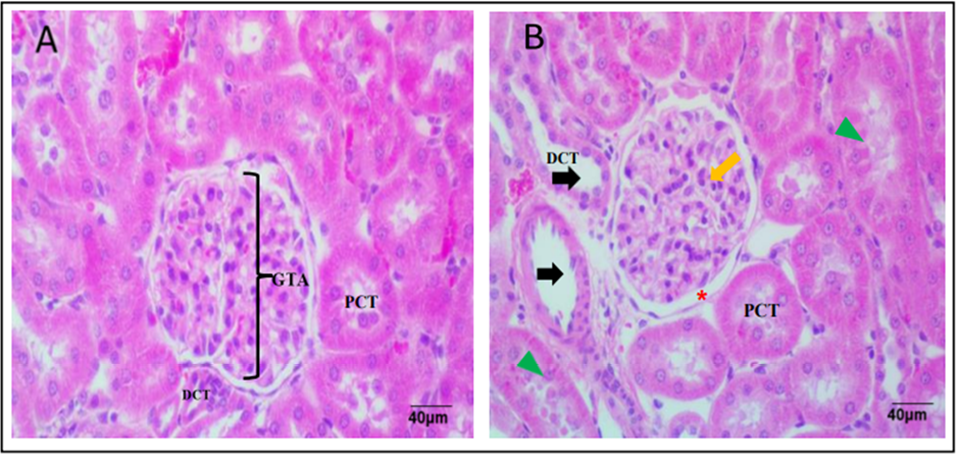
The connective tissue area fraction in the liver tissue of the DM group was significantly higher than that of the C group (Table 2). In H&E-stained sections of kidney tissues, the C group had normal renal corpuscular, glomerular, and tubular structures (Figure 5A). Kidney tissues from DM group showed glomerular basement membrane thickening, enlarged distal and proximal convoluted tubules (Figure 5B).
There were no statistically significant differences between glomerular tuft area of the control when compared to DM animals in a student t-test (Figure 4D; Table 3). The glomerular tuft area of DM animals was slightly lower than that of control animals (Figure 4D; Table 3). Similarly, the student t-test detected no statistically significant difference between renal corpuscular area of control and DM animals, even though a slight reduction was observed in the DM animals compared to control animals (Figure 4D; Table 3). The student t-test also detected no significant differences in the urinary space area between control and DM animals, with a slight increase in the urinary space area of DM animals (Figure 4D; Table 3).
| C | DM | P value | |||||||||||||||||
|---|---|---|---|---|---|---|---|---|---|---|---|---|---|---|---|---|---|---|---|
| RCA | 32177.98 ± 4067.97 | 31531.95 ± 1614.26 | 0.383 | ||||||||||||||||
| GTA | 24408.61 ± 3757.01 | 23448.74 ± 1503.30 | 0.294 | ||||||||||||||||
| USA | 7769.37 ± 1541.50 | 8083.22 ± 1205.63 | 0.379 | ||||||||||||||||
| GT CT Area fraction | 0.72 ± 0.29 | 1.39 ± 0.33 | 0.009 | ||||||||||||||||
| Data of all variables expressed as mean ±standard deviation. | |||||||||||||||||||
The corpuscular area also showed a slight nonsignificant reduction in DM animals in a student t-test (Table 3). There were no statistically significant differences between urinary space area of control and DM animals. The urinary space area of DM animals was slightly higher than that of control animals (Table 3).
The student t-test detected no significant differences in the outer area of the proximal convoluted tubule of control and DM animals, even though the proximal convoluted tubular area of the DM animals was slightly higher (Figure 4B; Table 4). Similarly, a non-significant increase in the proximal convoluted tubular luminal area was observed in DM animals compared to the control animals (Figure 4B; Table 4). The proximal convoluted tubular epithelial area also had no statistically significant differences, with slight increase in the epithelial area in DM compared to control animals (Figure 4B; Table 4). The student t-test detected no significant differences in the distal convoluted tubular outer area, luminal area and the epithelial area when comparing the DM to control animals. However, all three of the above parameters, showed a slight increase in DM animals (Figure 4C; Table 4).
| C | DM | P value | |||||||||||||||||
|---|---|---|---|---|---|---|---|---|---|---|---|---|---|---|---|---|---|---|---|
| PCT OA PCT LA |
6859.81 ± 753.91 1016.14 ± 149.55 |
11432.19 ± 10169.98 4739.05 ± 8531.91 |
0.167 0.171 |
||||||||||||||||
| PCT EA | 5843.67 ± 728.26 | 6693.14 ± 1667.22 | 0.172 | ||||||||||||||||
| DCT OA | 3512.40 ± 485.27 | 3676.71 ± 583.97 | 0.33 | ||||||||||||||||
| DCT LA | 1703.13 ± 329.16 | 34808.05 ± 81450.65 | 0.183 | ||||||||||||||||
| DCT EA | 1809.26 ± 223.19 | 2044.88 ± 384.15 | 0.107 | ||||||||||||||||
| Data of all variables expressed as mean ±standard deviation. | |||||||||||||||||||
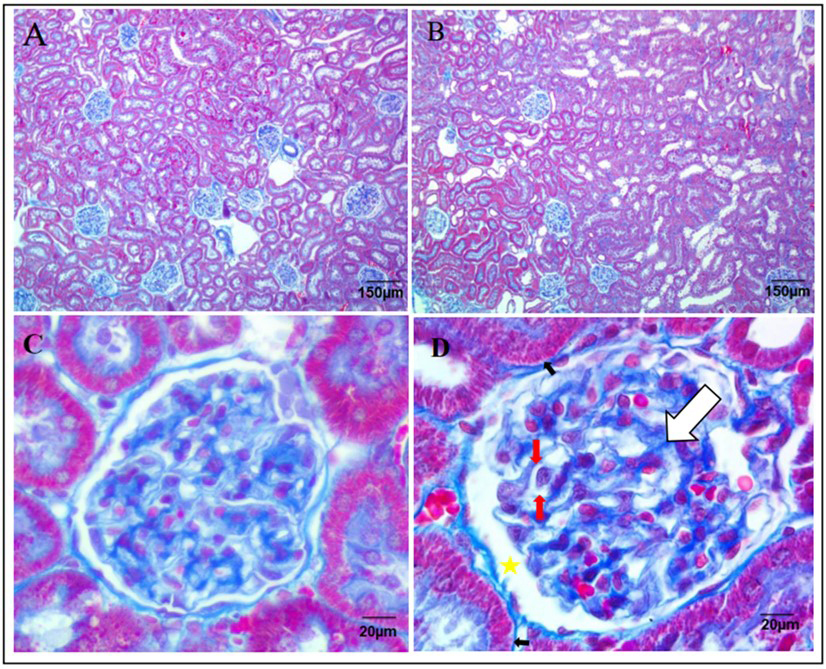
In MT-stained kidney tissues, moderate accumulation of glomerular connective tissue was observed in control animals (Figure 6A), whereas kidney tissues of DM animals showed excess accumulation of collagen fibers in the glomerular tuft (Figure 6B). The connective tissue area fraction in the glomerular tuft of DM animals was significantly higher than that of the control animals (Table 4).
Discussion
The study aimed to investigate the effects of a single dose of 50mg/kg Streptozocin (STZ) induced diabetes on the histomorphometry of the liver and kidneys of male Sprague Dawley rats over 21 days. Hyperglycemia caused by STZ resulted in a decrease in body weight over 21 days. This decrease could be attributed to the induction of ketoacidosis, wherein the body, lacking insulin in Type 1 Diabetes Mellitus (T1DM), turns to fat oxidation, leading to the production of ketones and subsequent weight loss (Dhillon and Gupta, 2018).
Liver weights decreased in STZ-induced diabetic rats compared to controls, in agreement with Salahshoor et al. 2019 who found the same weight differences even though they used a higher dose (60mg/kg) and a longer duration (28 days). The observed weight reduction is likely due to high blood glucose levels causing cell damage and liver cell shrinkage (Michalopoulos and Bhushan, 2021). Conversely, kidney weights exhibited a slight increase, possibly indicating fibrosis due to renal inflammation. Histomorphometric analysis revealed significant changes in hepatocellular and renal structures. In the liver, an increase in hepatocyte area in zone 1 was observed in diabetic induced animals, potentially indicating steatohepatitis, characterized by liver inflammation and fat accumulation (Scorletti and Carr, 2022). There was a decrease in the zone 3 hepatocellular area, nuclear area and cytoplasmic area of diabetic induced animals compared to control animals. The observed decrease in hepatocytes of zone 3 could be due to steatosis associated with NAFLD. Non-alcoholic fatty liver disease can cause a decrease of hepatocytes through NASH which is characterized by inflammation and damage to liver cells that can lead to shrinkage and death of hepatocytes (Brunt et al., 2015). Steatosis is one of the prominent effects of diabetes in the liver. However, in the current study, steatosis was not observed in the liver tissues of diabetic animals. A previous study that observed the animals for a period of six weeks recorded severe steatosis in the liver tissues of the animals suggesting that steatosis is related to prolonged periods of diabetes (Yao et al., 2021).
Connective tissue area fraction around hepatocytes increased slightly, suggesting inflammation-induced liver fibrosis. Such increases are attributed to chronic inflammation, activating hepatic stellate cells and promoting connective tissue fiber production, leading to liver fibrosis (Faddladdeen and Ojaimi, 2019). Inflammatory markers like TNF-α, IL-6, and IL-1β, along with TGF-β, are implicated in the above process (Akbari and Hassan-Zadeh, 2018). Additionally, chemokines like MCP-1 and normal T cell expressed may contribute to immune cell recruitment to the liver in diabetic liver disease (Mohammadi et al., 2019). Similarly, in the kidneys, reduced renal corpuscular and glomerular tuft areas indicated inflammation-related shrinkage, while increased urinary space area suggested glomerular damage (Hu and Layton, 2021). Proximal and distal convoluted tubules exhibited hypertrophy, possibly due to prolonged exposure to elevated glucose levels, leading to epithelial cell degeneration (Hu and Layton, 2021).
Connective tissue area fraction was measured in glomerular tuft of kidney tissues. Our findings showed a significant increase in the connective tissue area fraction in the glomerular tuft of DM animals compared to control animals. These results are in agreement with that of Jia et al. 2018 (55mg/kg observed for 8 weeks) who recorded similar results, stating that an increase of connective tissue is involved in the pathophysiology of diabetic nephropathy such as fibrosis in the glomeruli.
Conclusion
The current study successfully induced hyperglycemia in rats using a single dose of 50mg/kg Streptozocin (STZ), resulting in significant histomorphometric changes in the liver that manifested as increased hepatocyte area in zone 1 and reduced size in zone 3 over 21 days. However, no significant changes were observed in the kidneys. The findings suggest that while 50mg/kg STZ-induced diabetes affects some aspects of the histomorphometry of the liver and kidneys within 21 days, it does not produce full pathologic profile as recorded in other studies. Future studies should consider extending observation periods for comprehensive analysis of liver and kidney tissue changes.
Author contributions
Conceptualization: MK Mpholwane, PA Mbelengwa and NK Xhakaza. Manuscript drafting: PA Mbelengwa. Critical review of the manuscript: ML Mpholwane and NK Xhakaza. Final manuscript approval: Both authors.
References
Abd Rashed, A., & Rathi, D.N.G. 2021. Bioactive components of Salvia and their potential antidiabetic properties: A review. Molecules, 26(10): 3042.
Akbari, M., & Hassan-Zadeh, V. 2018. IL-6 signalling pathways and the development of type 2 diabetes. Inflammopharmacology, 26: 685-698.
Brunt, E.M., Wong, V.W.S., Nobili, V., Day, C.P., Sookoian, S., Maher, J.J., Bugianesi, E., Sirlin, C.B., Neuschwander-Tetri, B.A. & Rinella, M.E. 2015. Nonalcoholic fatty liver disease. Nature reviews Disease primers, 1(1): 1-22.
Calzadilla Bertot, L. & Adams, L.A. 2016. The natural course of non-alcoholic fatty liver disease. International journal of molecular sciences, 17(5): 774.
Dhillon, K.K. & Gupta, S. 2018. Biochemistry, Ketogenesis. National Library of Medicine.
Faddladdeen, K.A. & Ojaimi, A.A. 2019 .Protective effect of pomegranate (Punica granatum) extract against diabetic changes in adult male rat liver: histological study. Journal of microscopy and ultrastructure, 7(4): 165.
Fazelipour, S., Kiaei, S.B., Tootian, Z. & Dashtnavard, H. 2008. Histomorphometric study of hepatocytes of mice after using heroin. International Journal of Pharmacology, 4(6): 496-9.
Guilherme, A., Henriques, F., Bedard, A.H. & Czech, M.P. 2019. Molecular pathways linking adipose innervation to insulin action in obesity and diabetes mellitus. Nature Reviews Endocrinology, 15(4): 207-225.
Hossain, M.A. & Pervin, R. 2018. Current antidiabetic drugs: review of their efficacy and safety. Nutritional and therapeutic interventions for diabetes and metabolic syndrome, 455-473.
Hu, R. & Layton, A. 2021. A computational model of kidney function in a patient with diabetes. International journal of molecular sciences, 22(11): 5819.
Michalopoulos, G.K. & Bhushan, B. 2021. Liver regeneration: biological and pathological mechanisms and implications. Nature reviews Gastroenterology & hepatology, 18(1): 40-55.
Jia, Q., Yang, R., Liu, X.F., Ma, S.F. & Wang, L. 2019. Genistein attenuates renal fibrosis in streptozocin induced diabetic rats. Molecular medicine reports, 19(1): 423-431.
Mohamed, J., Nafizah, A.N., Zariyantey, A.H. & Budin, S. 2016. Mechanisms of diabetes-induced liver damage: the role of oxidative stress and inflammation. Sultan Qaboos University Medical Journal, 16(2): 132.
Mohammadi, A., Blesso, C.N., Barreto, G.E., Banach, M., Majeed, M. & Sahebkar, A. 2019. Macrophage plasticity, polarization and function in response to curcumin, a diet-derived polyphenol, as an immunomodulatory agent. The Journal of nutritional biochemistry, 66: 1-16.
Nakayama, T., Kosugi, T., Gersch, M., Connor, T., Sanchez-Lozada, L.G., Lanaspa, M.A., Roncal, C., Perez-Pozo, S.E., Johnson, R.J. & Nakagawa, T. 2010. Dietary fructose causes tubulointerstitial injury in the normal rat kidney. American journal of physiology-renal physiology, 298(3): 712-720.
Naseri, M., Sereshki, Z.K., Ghavami, B., Zangii, B.M., Kamalinejad, M., Moghaddam, P.M., Asghari, M., Hasheminejad, S.A., Emadi, F. & Ghaffari, F. 2022. Preliminary results of effect of barley (Hordeum vulgare L.) extract on liver, pancreas, kidneys and cardiac tissues in streptozocin induced diabetic rats. European Journal of Translational Myology, 32(1).
Norgaard, S.A., Sondergaard, H., Sorensen, D.B., Galsgaard, E.D., Hess, C. & Sand, F.W. 2020. Optimising streptozocin dosing to minimise renal toxicity and impairment of stomach emptying in male 129/Sv mice. Laboratory Animals, 54(4): 341-352.
Salahshoor, M.R., Mohammadi, M.M., Roshankhah, S., Najari, N. & Jalili, C. 2019. Effect of Falcaria vulgaris on oxidative damage of liver in diabetic rats. Journal of Diabetes & Metabolic Disorders, 18: 15-23.
Schneider, C.A., RASBAND, W.S. & Elicieri K.W. 2012. NIH Image to ImageJ: 25 years of image analysis. Nature Methods, 9(7): 671.
Scorletti, E. & Carr, R.M. 2022. A new perspective on NAFLD: Focusing on lipid droplets. Journal of hepatology, 76(4): 934-945.
Sellamuthu, P.S., Arulselvan, P., Kamalraj, S., Fakurazi, S. & Kandasamy, M. 2013. Protective nature of mangiferin on oxidative stress and antioxidant status in tissues of streptozocin-induced diabetic rats. International Scholarly Research Notices, 2013(1): 750109.
Sun, H., Saeedi, P., Karuranga, S., Pinkepank, M., Ogurtsova, K., Duncan, B.B., Stein, C., Basit, A., Chan, J.C., Mbanya, J.C. & Pavkov, M.E. 2022. IDF Diabetes Atlas: Global, regional and country-level diabetes prevalence estimates for 2021 and projections for 2045. Diabetes research and clinical practice, 183: 109119.
Tang, S.C. 2018. September. An overview of IgA nephropathy: 50 years on. Seminars in nephrology, 38(5): 433-434.
World Health Organization. 2022. Diabetes. Diabetes (who.int)
Yao, M., Teng, H., Lv, Q., Gao, H., Guo, T., Lin, Y., Gao, S., Ma, M. & Chen, L. 2021. Anti-hyperglycemic effects of dihydromyricetin in streptozocin-induced diabetic rats. Food Science and Human Wellness, 10(2): 155-162.